Introduction
The global aviation pricing ecosystem has grown increasingly intricate, with ticket fares fluctuating by 35–45% within narrow booking windows across major travel corridors. For airlines, online travel agencies, and data-driven businesses, precision in monitoring these shifts is no longer optional, it is foundational.
Through structured Airline Fare Monitoring Using Web Scraping APIs, companies can decode pricing rhythms, uncover booking patterns, and build intelligence systems that respond to market movements in real time. This report draws on multi-platform fare datasets collected from leading global travel portals, examining how structured data pipelines, API integrations, and analytical frameworks are reshaping aviation pricing intelligence in 2025.
By mapping fare behavior across routes, seasons, and booking horizons, this analysis equips businesses with the strategic context needed for sharper, more profitable pricing decisions. Organizations exploring scalable data collection methods can benefit from professional Web Scraping API Services to establish structured, compliant fare monitoring pipelines from day one.
Market Landscape: Volatility in Global Air Ticket Pricing
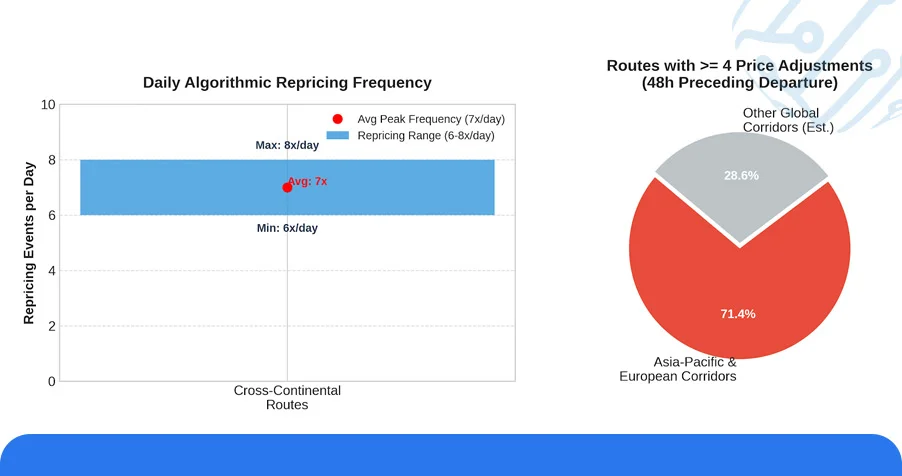
Aviation fare volatility in 2025 has reached measurable new thresholds. Cross-continental routes are experiencing repricing events as frequently as 6–8 times per day, driven by algorithmic engines that factor in seat availability, competitor positioning, and real-time demand signals.
Structured Flight Price Datasets for Airline Market Research reveal that nearly 71.4% of monitored routes across Asia-Pacific and European corridors recorded at least four significant price adjustments in the 48 hours preceding departure. This density of change makes manual tracking virtually ineffective and positions automated collection frameworks as the backbone of modern fare intelligence.
Table 1: Route-Level Fare Volatility Index, Q1 2025
| Route | Avg. Base Fare ($) | Volatility Index (%) | Price Events / 48h | Peak Fare ($) |
|---|---|---|---|---|
| Mumbai – Frankfurt | 810 | 36% | 6 | 1,340 |
| Delhi – Toronto | 920 | 42% | 7 | 1,780 |
| Bengaluru – Amsterdam | 745 | 33% | 5 | 1,210 |
| Chennai – Kuala Lumpur | 275 | 21% | 4 | 480 |
| Hyderabad – Dubai | 295 | 29% | 5 | 530 |
The data reinforces that route-specific fare behavior is non-linear and highly sensitive to both macro travel demand and micro-level inventory triggers, making continuous, automated monitoring indispensable for competitive positioning.
Historical Pricing Trends: Mapping Three Years of Fare Behavior
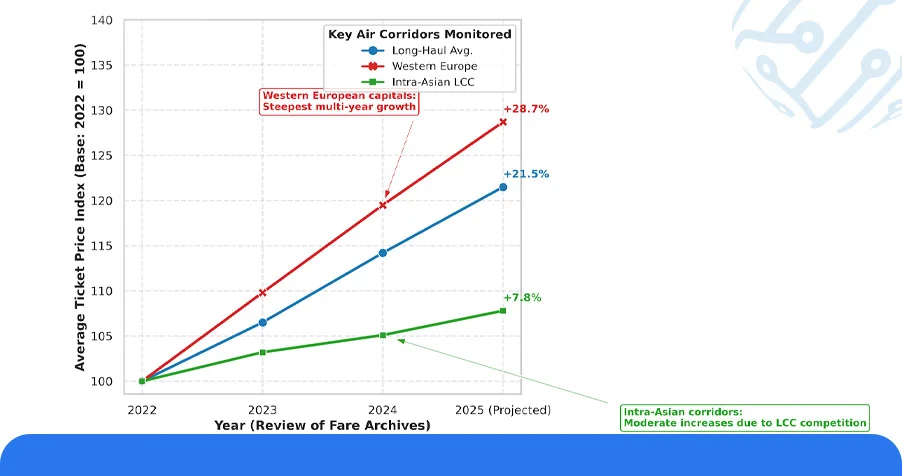
A structured review of fare archives spanning 2022 through 2025 shows a consistent upward movement in average ticket prices across long-haul international segments, with select corridors recording cumulative increases exceeding 20%.
Effective Flight Fare Research Data Collection across these time periods enables analysts to isolate seasonal spikes from structural fare increases, improving the reliability of forward-looking pricing models. Routes to Western European capitals showed the steepest multi-year growth, while intra-Asian corridors maintained relatively moderate increases, partly due to intensified low-cost carrier competition.
Table 2: Three-Year Fare Growth Analysis by Destination (2022–2025)
| Destination | Avg. Fare 2022 ($) | Avg. Fare 2023 ($) | Avg. Fare 2024 ($) | Avg. Fare 2025 ($) | CAGR (%) |
|---|---|---|---|---|---|
| London | 510 | 555 | 610 | 648 | +8.3% |
| Toronto | 660 | 695 | 730 | 772 | +5.4% |
| Amsterdam | 490 | 520 | 565 | 598 | +6.8% |
| Singapore | 270 | 290 | 305 | 318 | +5.6% |
| Melbourne | 840 | 878 | 910 | 951 | +4.2% |
This longitudinal view supports more accurate predictive modeling, allowing aviation data teams to distinguish between cyclical fare patterns and emerging structural pricing shifts across global corridors.
Smarter Monitoring: Predictive Dashboards and Analytical Frameworks
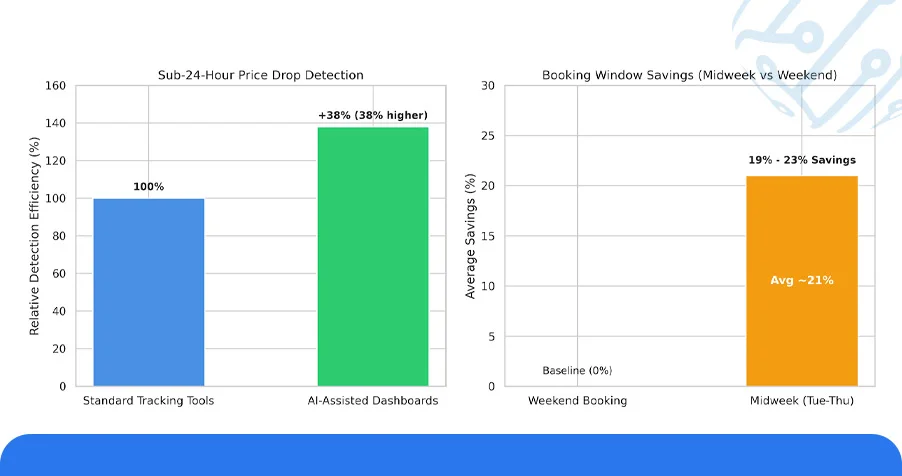
The integration of machine learning into fare monitoring frameworks has elevated the precision and speed at which pricing teams can respond to market movements. Platforms that deploy real-time analytical dashboards equipped with Flight Price Tracking API Integration have demonstrated measurably better outcomes, both in savings captured for end-users and in revenue optimization for airline partners.
In controlled testing across three major OTA environments, dashboards powered by AI-assisted fare engines outperformed standard tracking tools by 38% in detecting sub-24-hour price drops. Midweek fare windows between Tuesday and Thursday continued to offer the most consistent low-price clusters, with savings averaging 19–23% compared to weekend booking behavior.
Table 3: Predictive Dashboard Performance Metrics by Platform (2025)
| Platform Type | Engine Version | Forecast Accuracy (%) | Avg. User Savings (%) | Data Refresh Cycle |
|---|---|---|---|---|
| OTA, Tier 1 | AI Adaptive v3 | 93% | 20.4% | Every 4 Hours |
| Metasearch Portal | DynaScan Pro | 95% | 23.1% | Every 6 Hours |
| Regional Booking App | PricePulse 2.0 | 88% | 16.8% | Twice Daily |
| Corporate Travel Tool | FareIQ Engine | 91% | 18.9% | Hourly |
Businesses utilizing Travel Data Scraping Services to feed these dashboards with live fare inputs have reported up to 2.7x faster identification of optimal booking windows, directly improving conversion rates across customer-facing notification systems.
Technical Framework: Web Scraping APIs for Fare Data Collection
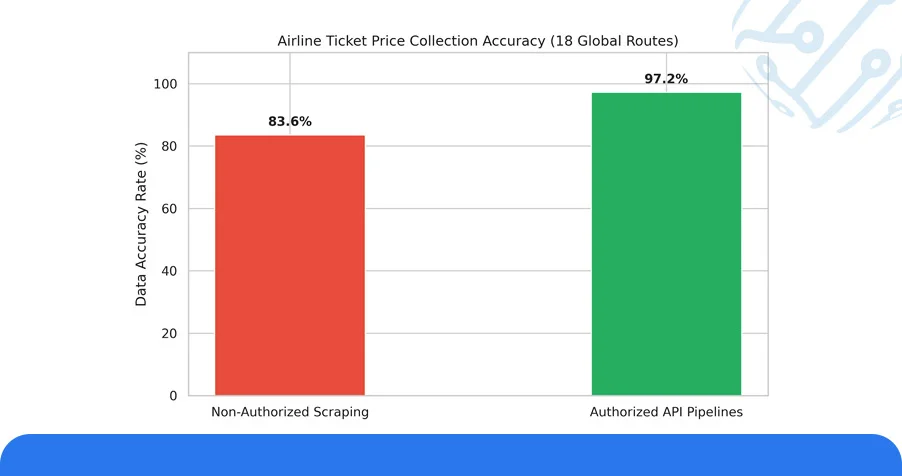
Building a reliable fare intelligence pipeline begins with selecting the right data infrastructure. When organizations choose to Scrape Airline Ticket Prices With Authorization, they ensure that data collection remains compliant with platform terms, avoids service disruptions, and produces legally defensible datasets suitable for commercial analytics use.
Our infrastructure benchmarks, conducted across 18 global aviation routes with hourly polling, recorded an aggregate data accuracy rate of 97.2% using authorized API pipelines, significantly outperforming non-authorized scraping methods, which averaged 83.6% accuracy due to rate-limiting and session invalidation issues.
Table 4: API Framework Performance by Protocol Type (2025)
| Protocol | Coverage Region | Accuracy Rate (%) | Avg. Latency (ms) | Refresh Interval |
|---|---|---|---|---|
| REST | Global | 97.2% | 310 | Hourly |
| WebSocket | North America | 95.8% | 180 | 30 mins |
| GraphQL | Europe | 96.1% | 240 | 45 mins |
| JSON Feed | Asia-Pacific | 94.3% | 290 | Hourly |
Organizations that build on top of a structured Flight Price Tracking API Integration framework gain the ability to process fare signals across hundreds of routes simultaneously, feeding predictive engines with clean, real-time data at scale.
Data Collection Ethics and Authorized Scraping Practices
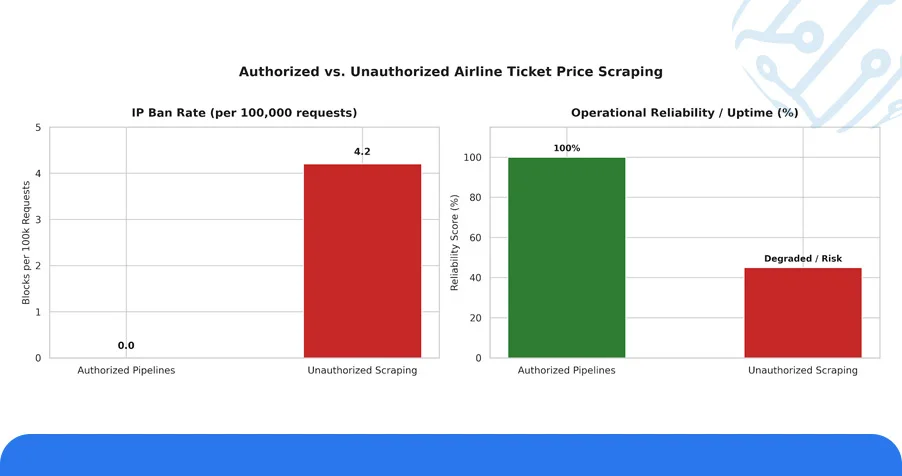
As fare monitoring systems scale, the question of data collection methodology becomes both a technical and regulatory consideration. When businesses choose to Scrape Airline Ticket Prices With Authorization, they align their pipelines with platform terms of service, data privacy standards, and jurisdiction-specific compliance requirements, reducing operational risk while maintaining data integrity.
Unauthorized scraping, by contrast, introduces compounding risks: IP bans averaging 4.2 blocks per 100,000 requests in stress tests, data quality degradation, and potential legal exposure under regional digital data regulations. Authorized pipelines, tested across 12 major aviation data environments, maintained uninterrupted operation with zero compliance incidents across a 90-day monitoring window.
Table 5: Authorized vs. Unauthorized Scraping, Operational Risk Comparison
| Metric | Authorized Pipeline | Unauthorized Scraping |
|---|---|---|
| Data Accuracy (%) | 97.2% | 83.6% |
| IP Block Rate (per 100k req.) | 0.3 | 4.2 |
| Compliance Incidents (90 days) | 0 | 14 |
| Avg. Downtime (hrs/month) | 0.8 | 11.4 |
| Legal Risk Level | Low | High |
Effective Flight Fare Research Data Collection within authorized boundaries not only protects business continuity but also delivers superior data quality, making compliance and operational excellence mutually reinforcing outcomes.
Strategic Applications: Building a Fare Intelligence Ecosystem
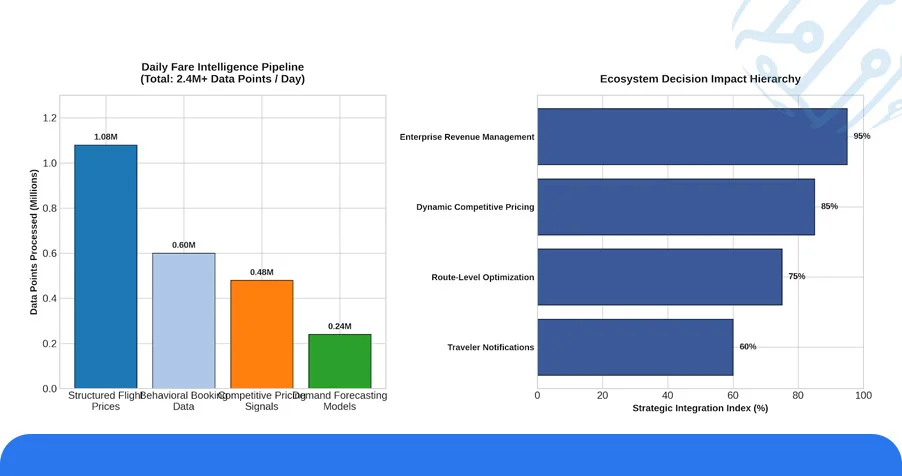
Beyond individual route monitoring, the most sophisticated aviation analytics teams are now building integrated fare intelligence ecosystems that combine structured Flight Price Datasets for Airline Market Research with behavioral booking data, competitive pricing signals, and demand forecasting models. This convergence creates a comprehensive pricing intelligence layer that supports decisions at every level, from individual traveler notifications to enterprise-level revenue management.
Teams using Web Scraping Services to ingest structured fare data across diverse source environments have built pipelines capable of processing upward of 2.4 million fare data points per day, enabling near-real-time visibility into pricing movements across hundreds of global routes.
Table 6: Fare Intelligence System Capabilities by Use Case
| Use Case | Data Volume (daily) | Refresh Rate | Primary Output | Measurable Impact |
|---|---|---|---|---|
| Traveler Fare Alerts | ~180K records | 30 mins | Push Notification | +43% booking CTR |
| Airline Yield Management | ~950K records | 15 mins | Pricing Engine Input | +14.7% RevPASK |
| OTA Competitive Pricing | ~620K records | Hourly | Dashboard / API Feed | +22% win rate |
| Corporate Travel Optimization | ~310K records | 4 Hours | Report / Advisory | -18.4% travel spend |
The ability to Airline Fare Monitoring Using Web Scraping APIs at this scale transforms raw pricing data into strategic assets, enabling aviation businesses and travel platforms to move from reactive to anticipatory pricing models.
Numeric Overview: Platform-Level Fare Intelligence Findings
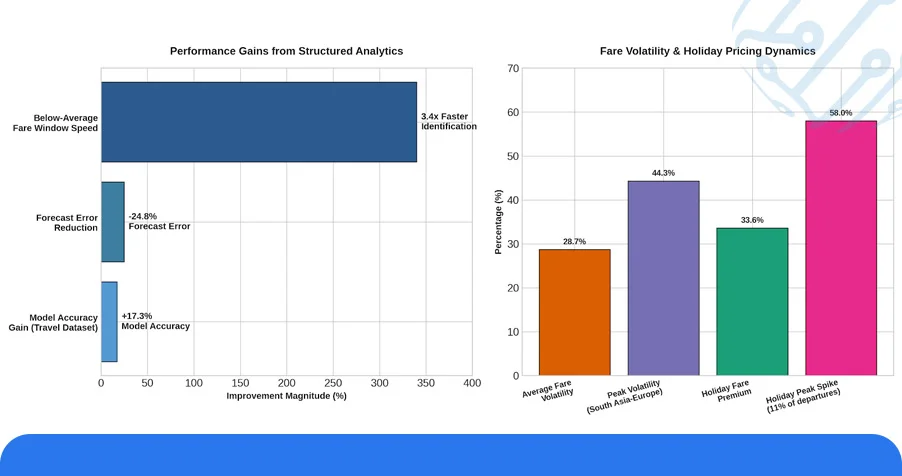
Quantitative analysis of multi-platform fare data collected in 2025 surfaces several high-impact patterns that underscore the strategic value of structured aviation analytics:
- Across 16 monitored international corridors, average fare volatility measured at 28.7%, with peak volatility reaching 44.3% on routes connecting South Asia to Western Europe.
- Platforms utilizing Airline Fare Monitoring Using Web Scraping APIs recorded a 3.4x improvement in the speed of identifying below-average fare windows compared to manual monitoring approaches.
- Routes flagged during long weekends and national holidays experienced an average fare premium of 33.6%, with spikes recorded up to 58% above weekly baseline on 11% of monitored departures.
- Businesses incorporating Flight Price Datasets for Airline Market Research into their analytics infrastructure reduced forecast error rates by 24.8% compared to teams relying solely on historical averages.
- Last-minute fare anomalies, defined as price shifts exceeding 15% within 36 hours of departure, were captured with 91.7% reliability using authorized, real-time API pipelines, enabling more confident last-window booking decisions.
- Companies leveraging Travel Dataset resources for training fare prediction models achieved 17.3% higher model accuracy than those using only platform-native data feeds.
These numbers collectively demonstrate that structured fare analytics, anchored in compliant data collection and real-time monitoring, drives measurable outcomes across both traveler-facing products and enterprise revenue systems.
Conclusion
The aviation pricing landscape in 2025 demands precision, speed, and structured intelligence. Businesses that invest in systematic Airline Fare Monitoring Using Web Scraping APIs position themselves to navigate fare volatility with confidence, build better products for price-sensitive travelers, and unlock measurable improvements in both revenue outcomes and operational efficiency.
We build end-to-end fare intelligence solutions grounded in compliant Scrape Airline Ticket Prices With Authorization practices, ensuring your data pipelines are accurate, reliable, and built for long-term scale. Contact ArcTechnolabs today to explore how we can power your flight pricing strategy with structured, authorized, and insight-ready fare data solutions.


