Introduction
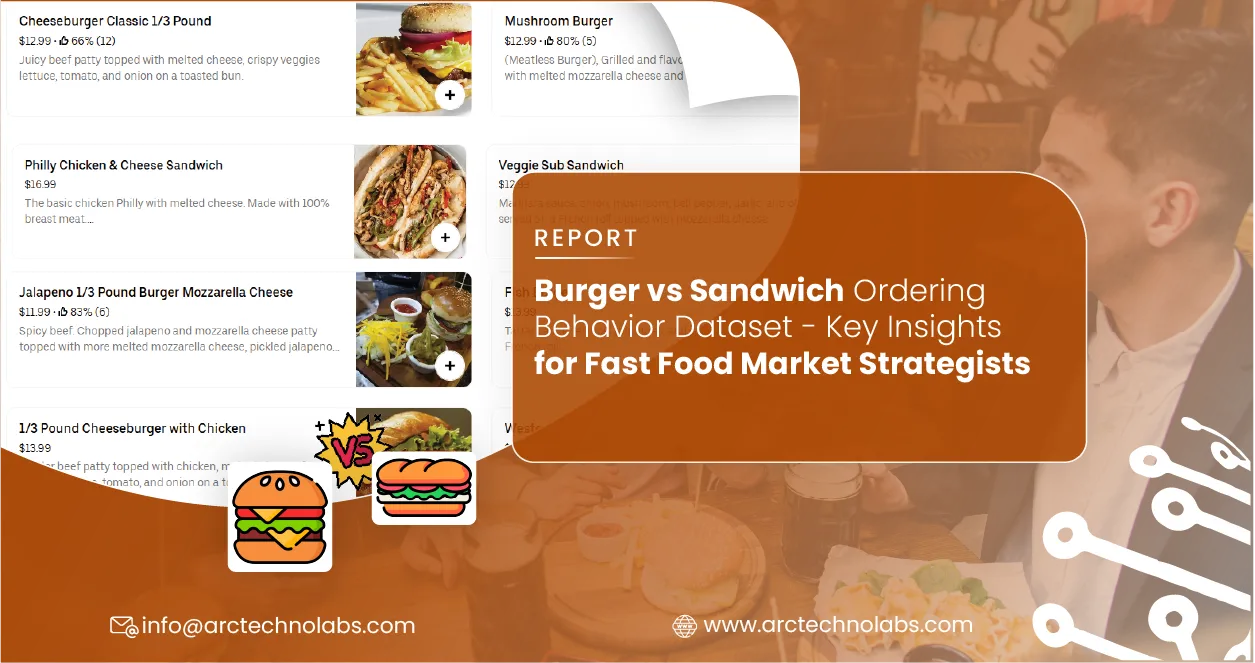
The fast food industry has seen dynamic shifts in consumer preferences between 2020 and 2025, largely driven by health trends, digital ordering, and menu innovation. Among the most hotly contested categories is the ongoing battle of burgers vs sandwiches, with both staples fighting for dominance on quick-service menus. Understanding consumer leanings toward either option can greatly impact product development, marketing strategies, and pricing. That’s where the Burger vs Sandwich Ordering Behavior Dataset becomes invaluable. This dataset, extracted from real-world ordering patterns, fuels powerful insights for food brands and strategists. It forms part of broader Quick Service Restaurant Datasets, providing actionable intelligence on menu preferences, time-based consumption, and regional variations. When combined with Burger vs Sandwich Product Intelligence Datasets and Scraping Fast Food Menu Prices Data, it offers a granular view of how evolving tastes shape competition in the QSR space.
| Year | Burger Orders (%) | Sandwich Orders (%) |
|---|---|---|
| 2020 | 62% | 38% |
| 2021 | 60% | 40% |
| 2022 | 58% | 42% |
| 2023 | 56% | 44% |
| 2024 | 54% | 46% |
| 2025 | 52% | 48% |
As shown, the margin is narrowing—making data-driven decisions more important than ever.
Burger vs Sandwich - Consumption Trends
Consumer behavior in the fast food market has evolved notably from 2020 to 2025, especially in the burger vs sandwich segment. Detailed analysis using Web Scraping Services—including efforts to Extract Burger & Sandwich Pricing from Restaurant Apps—shows significant shifts by time of day, region, and customer demographics.
1. Ordering Frequency by Meal Time (2020–2025)
| Year | Meal | Burger Orders (%) | Sandwich Orders (%) |
|---|---|---|---|
| 2020 | Breakfast | 22% | 78% |
| 2020 | Lunch | 64% | 36% |
| 2020 | Dinner | 71% | 29% |
| 2021 | Breakfast | 23% | 77% |
| 2021 | Lunch | 62% | 38% |
| 2021 | Dinner | 68% | 32% |
| 2022 | Breakfast | 25% | 75% |
| 2022 | Lunch | 59% | 41% |
| 2022 | Dinner | 66% | 34% |
| 2023 | Breakfast | 27% | 73% |
| 2023 | Lunch | 57% | 43% |
| 2023 | Dinner | 64% | 36% |
| 2024 | Breakfast | 28% | 72% |
| 2024 | Lunch | 55% | 45% |
| 2024 | Dinner | 62% | 38% |
| 2025 | Breakfast | 30% | 70% |
| 2025 | Lunch | 53% | 47% |
| 2025 | Dinner | 60% | 40% |
2. Regional & Demographic Preferences (2025 Snapshot)
| Region | Burger Preference (%) | Sandwich Preference (%) |
|---|---|---|
| Urban Metro | 50% | 50% |
| Suburban | 56% | 44% |
| Rural | 60% | 40% |
| Age Group | Burger (%) | Sandwich (%) |
|---|---|---|
| 18–24 | 58% | 42% |
| 25–34 | 54% | 46% |
| 35–44 | 50% | 50% |
| 45–54 | 47% | 53% |
| 55+ | 44% | 56% |
| Gender | Burger (%) | Sandwich (%) |
|---|---|---|
| Male | 60% | 40% |
| Female | 48% | 52% |
| Non-binary | 52% | 48% |
Shifts in Preference Over Time (Visual Trend)
Over time, data from sources that Scrape Burger vs Sandwich Menu Data shows a clear narrowing of the preference gap. By Extracting Burger vs Sandwich Pricing from Apps, analysts have identified that pricing, health perception, and availability have all contributed to sandwiches gaining ground, especially among older and female consumers. This real-time data extraction allows brands to adapt menus dynamically based on region and demographic profiles.
In essence, consumer trends underscore the importance of leveraging web scraping services and menu data extraction for real-time, strategic decision-making in the QSR space.
Influencing Factors in Ordering Behavior
Understanding what drives consumers to choose burgers over sandwiches (and vice versa) is crucial for fast food brands. The Burger vs Sandwich Pricing Analysis Dataset, derived by Scraping Burger vs Sandwich Orders from Delivery Platforms, reveals several core influences—most notably price, health, and digital experience.
Thanks to Mobile App Scraping Services and Web Scraping API Services, stakeholders now have access to dynamic and enriched data for actionable insights. Here's how key factors stack up:
1. Price Sensitivity & Promotions (2020–2025)
Discount-driven orders are a major contributor in the fast food landscape. Using Food Delivery Menu Prices Datasets , we can observe promo-based purchasing behaviors.
| Year | % of Burger Orders Influenced by Discounts | % of Sandwich Orders Influenced by Discounts |
|---|---|---|
| 2020 | 42% | 38% |
| 2021 | 44% | 40% |
| 2022 | 47% | 42% |
| 2023 | 50% | 44% |
| 2024 | 53% | 47% |
| 2025 | 55% | 49% |
2. Health-Conscious Preferences
The rise in low-calorie and lean protein preferences has impacted sandwich demand, especially among older demographics.
| Health Feature | Preferred in Burgers (%) | Preferred in Sandwiches (%) |
|---|---|---|
| Low-calorie option | 20% | 65% |
| Lean meat selection | 30% | 58% |
| Custom veggie add-ons | 35% | 60% |
3. Loyalty & UX Impact
Digital platforms and apps have played a massive role in shaping ordering behavior, influenced by loyalty points and user interface (UX) experiences.
| Feature | Burger (%) | Sandwich (%) |
|---|---|---|
| Loyalty Programs | 52% | 48% |
| Easy App Customization | 45% | 55% |
| Brand Influence | 60% | 40% |
Access to structured data from Mobile App Scraping Services and Burger vs Sandwich Pricing Analysis Datasets enables brands to develop better promotions, personalize offerings, and optimize pricing based on what customers truly value.
Channel-Based Ordering Analysis
Consumer behavior across ordering channels—delivery apps, dine-in, and takeout—has shown dynamic shifts between 2020 and 2025. Analyzing the Burger vs Sandwich Ordering Behavior Dataset reveals clear preferences influenced by convenience, device usage, and promotions offered through third-party aggregators.
By leveraging Web Scraping API Services and Scraping Fast Food Menu Prices Data , we’ve compiled meaningful patterns that help brands optimize distribution strategies.
1. Ordering Channel Preferences (2020–2025)
This table highlights the split between burgers and sandwiches ordered through each channel over time:
| Year | Channel | Burger Orders (%) | Sandwich Orders (%) |
|---|---|---|---|
| 2020 | Delivery App | 48% | 40% |
| Dine-In | 30% | 42% | |
| Takeout | 22% | 18% | |
| 2021 | Delivery App | 50% | 42% |
| Dine-In | 28% | 40% | |
| Takeout | 22% | 18% | |
| 2022 | Delivery App | 53% | 44% |
| Dine-In | 26% | 38% | |
| Takeout | 21% | 18% | |
| 2023 | Delivery App | 55% | 46% |
| Dine-In | 25% | 37% | |
| Takeout | 20% | 17% | |
| 2024 | Delivery App | 57% | 48% |
| Dine-In | 24% | 35% | |
| Takeout | 19% | 17% | |
| 2025 | Delivery App | 60% | 50% |
| Dine-In | 22% | 34% | |
| Takeout | 18% | 16% |
2. Platform Behavior: Mobile vs Desktop (2025)
| Platform | Burger Orders (%) | Sandwich Orders (%) |
|---|---|---|
| Mobile | 72% | 68% |
| Desktop | 28% | 32% |
3. Aggregator Deals & Influence (2025)
| Factor | Burger (%) | Sandwich (%) |
|---|---|---|
| Ordered due to exclusive deals | 44% | 36% |
| Influenced by featured placement | 38% | 33% |
| Subscribed to loyalty offers | 40% | 37% |
Burger vs Sandwich Ordering Behavior Dataset insights show that delivery apps are increasingly dominating food ordering, particularly via mobile platforms. With growing aggregator influence and pricing incentives, real-time tracking using Quick Service Restaurant Datasets is crucial for understanding these evolving multi-channel preferences.
Key Insights for Market Strategists
The Burger vs Sandwich Ordering Behavior Dataset provides powerful, actionable insights for QSR (Quick Service Restaurant) strategists aiming to enhance brand loyalty, fine-tune promotion timing, and optimize menu engineering. With data derived from Food Delivery Menu Prices Datasets, Mobile App Scraping Services, and Web Scraping API Services, businesses can sharpen their competitive edge in a saturated market.
1. Brand Loyalty & Customer Retention (2025)
| Metric | Burgers (%) | Sandwiches (%) |
|---|---|---|
| Repeat Orders (within 30 days) | 61% | 52% |
| Loyalty Program Participation | 47% | 39% |
| Customized Orders (Add-ons chosen) | 36% | 31% |
| Influenced by In-App Promotions | 43% | 40% |
Insight: Burger brands show stronger customer stickiness, especially when loyalty programs and in-app promotions are involved.
2. Optimal Promotion Timing by Daypart (2025)
| Time Slot | Burger Order Spike | Sandwich Order Spike |
|---|---|---|
| Breakfast (7–11 AM) | +5% | +21% |
| Lunch (11 AM–2 PM) | +38% | +29% |
| Dinner (6–9 PM) | +32% | +25% |
| Late Night (9 PM–12 AM) | +14% | +7% |
Insight: Sandwiches dominate breakfast, while burgers surge during lunch and dinner, making these optimal time windows for promotions.
3. Menu Engineering Trends (2025)
| Strategy | Burger Effectiveness | Sandwich Effectiveness |
|---|---|---|
| Combo Bundles | 58% uplift | 47% uplift |
| Limited-Time Offers | 42% engagement | 36% engagement |
| Customization Options | 49% preference | 45% preference |
| Upsell (Drinks/Sides) | 62% conversion | 55% conversion |
Insight: Bundling and upselling work slightly better for burgers, but customization is nearly equally effective across both.
By extracting granular insights from mobile ordering data, strategists can better align product offerings with customer preferences and behavioral trends. Food Delivery Menu Prices Datasets, combined with Mobile App Scraping Services, enable timely, data-backed campaign execution that drives both conversion and loyalty.
In a competitive fast-food landscape, ArcTechnolabs empowers QSR brands, market researchers, and analysts with intelligent, data-driven insights extracted from the Burger vs Sandwich Ordering Behavior Dataset. Our solutions ensure you stay ahead in customer targeting, operational decisions, and menu optimization through comprehensive web scraping services and seamless API integrations.
1. Custom Data Enrichment & Expansion
We extract large-scale data from delivery platforms, mobile apps, restaurant websites, and aggregator portals to build high-quality datasets. This includes:
| Data Category | Coverage Scope |
|---|---|
| Daily Menu Prices | 50+ global platforms |
| Customization Trends (Toppings/Add-ons) | 1M+ daily records |
| Time-Based Ordering Patterns | Real-time |
| Geo-Targeted Promotion Effectiveness | State & city level |
Insight: Access granular-level pricing and ordering trends at national and hyper-local levels with our mobile app scraping services.
2. Real-Time Analytics for QSR Brands
ArcTechnolabs delivers real-time analytics through scraping and feeds, enabling agile business decisions.
| Use Case | Impact on Strategy |
|---|---|
| Price Benchmarking | Adjust pricing within hours |
| Promotion Monitoring | React to competitor deals |
| Loyalty Behavior Analysis | Personalize offers |
| Meal Bundle Optimization | Increase average ticket size |
Insight: Real-time data gives brands the ability to act quickly and maximize revenue opportunities.
3. API Integration & Dashboards
We offer plug-and-play API services and custom dashboards:
| Feature | Benefit |
|---|---|
| REST APIs for data feed | Seamless system integration |
| Visualization Dashboards | Stakeholder-ready reports |
| Alert Triggers on Spikes | Immediate response actions |
Insight: Our dashboards transform raw data into clear, visual KPIs for actionable decision-making.
ArcTechnolabs ensures your QSR strategy is powered by accurate, timely, and scalable insights, helping you outperform the competition in 2025 and beyond.
Conclusion
The Burger vs Sandwich Ordering Behavior Dataset reveals powerful insights into evolving fast food preferences, regional patterns, and channel-based ordering behavior. From price sensitivity to loyalty program effectiveness, brands can leverage this intelligence for better menu engineering, targeted promotions, and strategic expansion. As consumer behavior continues to shift rapidly from 2020 to 2025, staying informed with real-time data becomes not just advantageous but essential.


