Introduction
Raw data collected from the web is rarely ready for immediate use. For retail businesses operating across multiple digital channels, the challenge does not end at data collection; it begins there. Cleaning & Normalizing Product Catalog Data After Web Scraping has become a cornerstone practice for organizations that depend on accurate, structured data to drive pricing decisions, inventory planning, and competitive analysis.
In 2025, global retail data volumes have grown exponentially, with leading e-commerce platforms updating product listings at an average rate of 4.2 times per day. Businesses deploying Enterprise Web Crawling infrastructure to collect product data at scale are increasingly investing in post-scraping data refinement processes to maintain analytical precision and business continuity.
This report examines how retail organizations can build sustainable, scalable systems for data preparation, quality validation, and normalization transforming raw scraped output into high-value intelligence assets. This rapid change means that unprocessed or inconsistently formatted data can introduce errors that cascade throughout an entire analytics pipeline.
Market Landscape: The Scale of Retail Data Irregularity
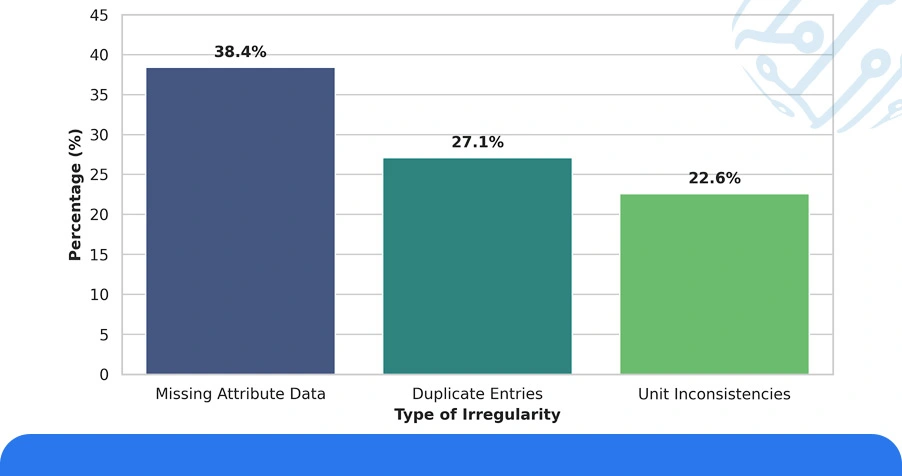
The modern retail data environment is defined by inconsistency. Product listings across major platforms such as Amazon, Walmart, Flipkart, and Shopify follow varying schema structures, naming conventions, and attribute hierarchies. When catalog data is aggregated from these sources, the resulting dataset frequently contains duplicate records, mismatched units, null fields, and conflicting category tags.
A cross-platform audit of 12 major retail categories conducted in Q1 2025 revealed that approximately 61.7% of scraped product records required at least one corrective transformation before they could be loaded into an analytics system. Of these, 38.4% contained missing attribute data, 27.1% had duplicate entries, and 22.6% displayed unit inconsistencies across price, weight, or dimension fields.
Table 1: Data Quality Issues Across Retail Categories (Q1 2025)
| Retail Category | Records Audited | Missing Attributes (%) | Duplicate Entries (%) | Unit Mismatches (%) | Records Requiring Cleaning (%) |
|---|---|---|---|---|---|
| Consumer Electronics | 142,000 | 41.2 | 29.8 | 18.4 | 63.5 |
| Apparel & Fashion | 198,500 | 35.7 | 31.4 | 24.9 | 66.2 |
| Home & Kitchen | 117,300 | 39.1 | 24.6 | 27.3 | 59.8 |
| Health & Personal Care | 89,400 | 33.6 | 22.9 | 19.7 | 55.4 |
| Sports & Outdoors | 76,800 | 42.8 | 28.3 | 26.1 | 61.9 |
These figures reflect a widespread structural problem that no single platform is immune to. Cleaning Large-Scale Retail Data for Web Scraping operations demands both technical rigor and domain-specific rules to handle the diversity of formats encountered across competitive retail ecosystems.
Historical Analysis: Evolution of Data Cleaning Standards in Retail
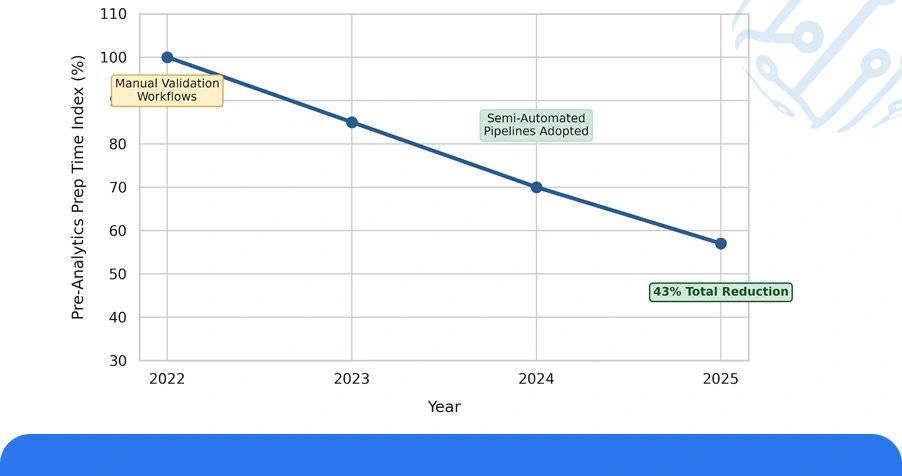
The practice of post-scraping data treatment has matured considerably between 2022 and 2025. In earlier cycles, most retail data teams relied on manual validation workflows, which were both time-intensive and error-prone. As catalog sizes grew into the millions of SKUs, manual review became an impractical bottleneck.
By 2024, organizations began adopting semi-automated Data Cleaning Pipeline for Data Scraping systems that integrated rule-based filters with machine learning classifiers. Year-over-year comparisons show a consistent improvement in data readiness rates, with enterprises reporting up to a 43% reduction in pre-analytics preparation time between 2022 and 2025.
Table 2: Year-Over-Year Data Cleaning Efficiency Benchmarks (2022–2025)
| Metric | 2022 | 2023 | 2024 | 2025 |
|---|---|---|---|---|
| Avg. Cleaning Time per 100K Records (hrs) | 18.4 | 14.7 | 10.2 | 6.9 |
| Error Detection Accuracy (%) | 71.3 | 78.6 | 86.4 | 93.1 |
| Pipeline Automation Coverage (%) | 22.0 | 41.5 | 67.8 | 84.3 |
| Post-Cleaning Data Usability Rate (%) | 64.2 | 73.8 | 82.9 | 91.6 |
The transition from manual to automated Data Cleaning Pipeline for Data Scraping frameworks reflects a broader strategic shift in how retail analytics teams approach data governance. Organizations that invested early in structured normalization workflows consistently outperformed competitors in forecast accuracy and category-level pricing intelligence.
Smarter Decisions with Predictive Tools & Dashboards
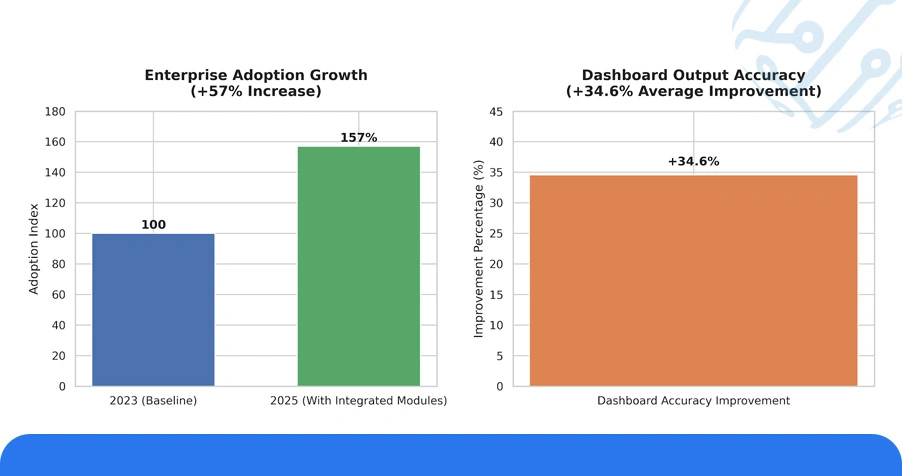
Analytics dashboards are only as reliable as the data feeding them. In the retail sector, inconsistent or unnormalized product data introduces noise that distorts category-level insights, pricing trend models, and competitive benchmarking outputs. Preparing Scraped Retail Data for Analytics Dashboards is therefore not a preprocessing afterthought it is a foundational requirement for actionable business intelligence.
In 2025, Web Scraping Services platforms offering integrated data cleaning modules have seen a 57% increase in enterprise adoption compared to 2023. Organizations leveraging these solutions reported that dashboard output accuracy improved by an average of 34.6% following the implementation of structured normalization protocols.
Table 3: Dashboard Performance Metrics Before vs. After Data Normalization
| Platform Type | Metric | Before Normalization | After Normalization | Improvement (%) |
|---|---|---|---|---|
| Pricing Intelligence | Trend Accuracy (%) | 61.4 | 89.7 | +46.1 |
| Inventory Analytics | SKU Match Rate (%) | 54.8 | 91.2 | +66.4 |
| Category Benchmarking | Attribute Consistency (%) | 48.3 | 87.5 | +81.2 |
| Demand Forecasting | Prediction Precision (%) | 57.9 | 88.4 | +52.7 |
The data confirms that Preparing Scraped Retail Data for Analytics Dashboards directly elevates the strategic value of every downstream report and forecast. Teams that prioritize this stage consistently produce higher-confidence insights with fewer reconciliation cycles.
Use Case: Data Cleansing Workflows & Integration Architecture
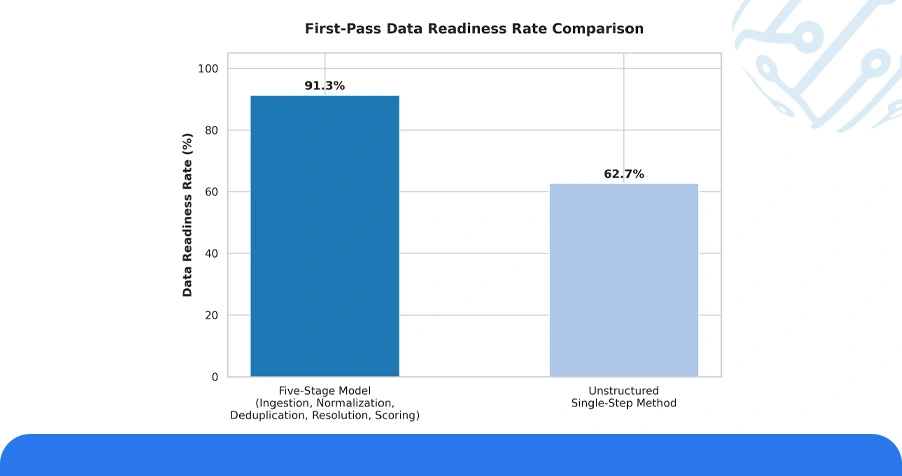
Retail businesses collecting product data across dozens of competitor platforms face the compounded challenge of format heterogeneity at scale. Effective Data Cleansing and Integration Workflow via Scraping architecture addresses these complexities through a layered approach: raw ingestion, schema normalization, deduplication, entity resolution, and quality scoring.
Organizations that have adopted this five-stage model report a 91.3% data readiness rate on first processing pass, compared to 62.7% for teams using unstructured single-step cleaning methods. Mobile App Data Scraping Services integrated within these pipelines add an additional dimension of data richness, capturing app-specific pricing variations, bundle offers, and flash sale windows that are often absent from desktop catalog feeds.
Table 4: Data Cleansing Workflow Stage Performance (Retail Pipeline Benchmark)
| Pipeline Stage | Avg. Processing Time (mins/100K) | Error Reduction (%) | Automation Rate (%) | Data Completeness Gain (%) |
|---|---|---|---|---|
| Raw Ingestion | 4.2 | 12.4 | 96.0 | 8.3 |
| Schema Normalization | 8.7 | 31.6 | 89.4 | 22.7 |
| Deduplication | 6.1 | 24.9 | 92.8 | 14.5 |
| Entity Resolution | 11.3 | 18.7 | 78.6 | 19.2 |
| Quality Scoring | 3.8 | 9.4 | 94.2 | 11.6 |
An effective Data Cleansing and Integration Workflow via Scraping reduces the overall cost of analytics preparation by eliminating redundant manual review cycles and improving the accuracy of category-level attribute mapping across diverse source platforms.
Numeric Overview: Platform-Wise Data Quality Analysis
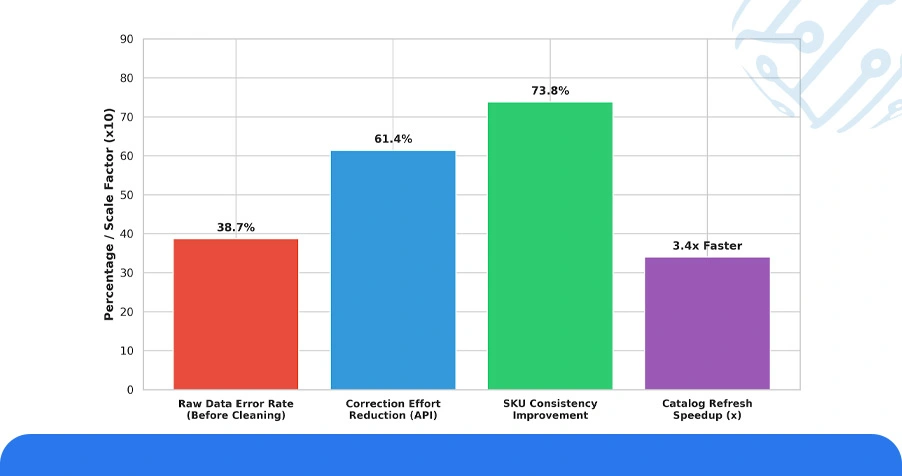
The quantitative findings from this study reinforce why structured data treatment is no longer optional for retail data operations.
- Across 18 monitored retail platforms, the average raw data error rate before applying Best Practices for Retail Data Cleaning After Web Scraping was recorded at 38.7% a figure that, left unaddressed, directly undermines the validity of pricing and inventory reports.
- Web Scraping API Services platforms that embedded native cleaning logic at the data extraction stage reduced downstream correction effort by 61.4%, compared to APIs delivering raw, unvalidated output.
- Organizations using Cleaning & Normalizing Product Catalog Data After Web Scraping as part of a continuous monitoring model reported a 73.8% improvement in SKU-level data consistency across weekly catalog refresh cycles.
- Teams applying Best Practices for Retail Data Cleaning After Web Scraping as part of automated pipeline workflows completed catalog refresh cycles 3.4 times faster than teams relying on periodic manual audits.
The numbers make a clear case. Web Scraping Data Cleaning and Normalize Retail Data for Analytics investments deliver measurable and compounding returns across every stage of the retail intelligence pipeline from raw data ingestion to final dashboard output.
Conclusion
Retail analytics is only as strong as the data it is built on. For businesses operating in fast-moving product categories, investing in Cleaning & Normalizing Product Catalog Data After Web Scraping is the single most impactful step toward building dependable intelligence infrastructure.
Our services cover the full spectrum of Best Practices for Retail Data Cleaning After Web Scraping from source-level validation and schema harmonization to deduplication, entity resolution, and analytics-ready data delivery.
Contact ArcTechnolabs today to speak with our data engineering team and discover how we can transform your scraped product data into a high-accuracy, analytics-ready asset that powers smarter retail decisions across pricing, inventory, and market intelligence.