Introduction
In today's rapidly evolving retail and e-commerce environment, knowing what your competitors are charging is no longer optional — it is a fundamental business requirement. With Mobile App Data Scraping Services, businesses can track competitor pricing movements, detect market shifts, and make faster, smarter decisions using structured and real-time data pipelines built for scale.
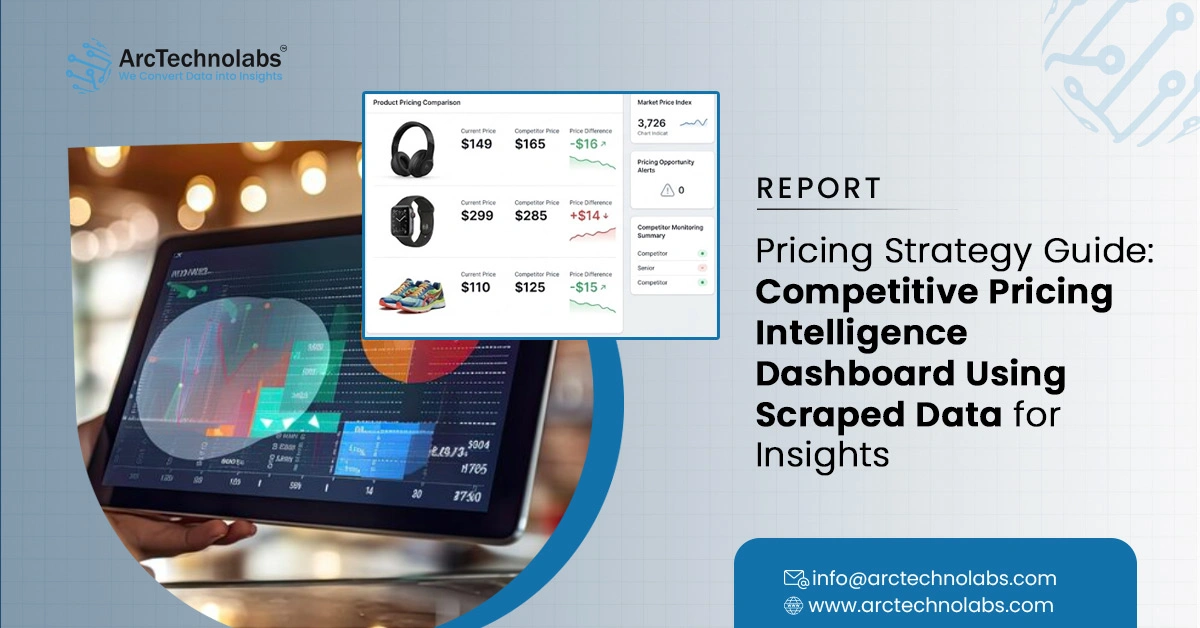
The modern pricing landscape is shaped by thousands of daily price updates across product categories, geographies, and platforms. A structured Competitive Pricing Intelligence Dashboard Using Scraped Data addresses this complexity by aggregating, normalizing, and visualizing competitor pricing in real time — giving pricing teams the clarity they need to act decisively.
This guide walks through the architecture, data sources, analytical frameworks, and strategic benefits of building such a system. From scraping methodologies to dashboard design, the sections ahead outline how Scrape Competitive Price for Monitoring Business Insights translates raw web data into structured competitive advantage for businesses at every stage of maturity.
Market Landscape: The Growing Need for Automated Price Intelligence
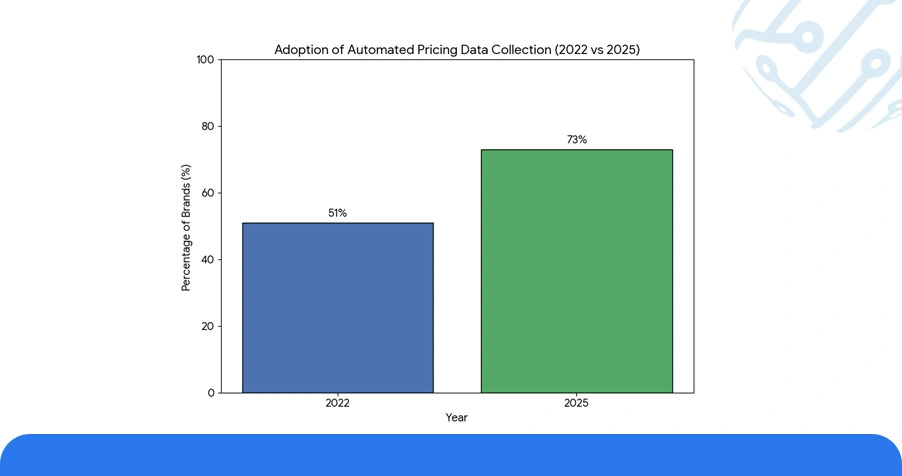
The global market for competitive intelligence tools is expanding at a compound annual growth rate of 11.4%, driven primarily by the rise of dynamic pricing in retail, travel, and consumer electronics. As of 2025, over 73% of mid-to-large e-commerce brands report using some form of automated pricing data collection to benchmark against competitors, up from 51% in 2022.
Pricing Data Scraping for Competitor Analysis has become a standard function within digital commerce teams, replacing spreadsheet-based manual tracking that typically lagged behind real-world pricing by 48–72 hours. Today, automated scraping systems collect pricing data at intervals as short as 15 minutes across thousands of SKUs simultaneously.
Table 1: Competitor Pricing Update Frequency by Sector (2025)
| Sector | Avg. Daily Price Changes per SKU | Monitoring Frequency Needed | Data Sources Tracked |
|---|---|---|---|
| Consumer Electronics | 4.2 | Every 30 mins | 8+ |
| Fashion & Apparel | 2.7 | Every 2 hrs | 6+ |
| Health & Beauty | 1.9 | Every 4 hrs | 5+ |
| Home & Furniture | 1.4 | Every 6 hrs | 4+ |
| Sports & Outdoors | 3.1 | Every 1 hr | 7+ |
The frequency gap between manual and automated monitoring widens significantly during promotional events. This reality has pushed adoption of Price Monitoring Dashboard Using Structured Datasets beyond early adopters into mainstream enterprise operations.
Historical Patterns in Competitive Pricing Behavior
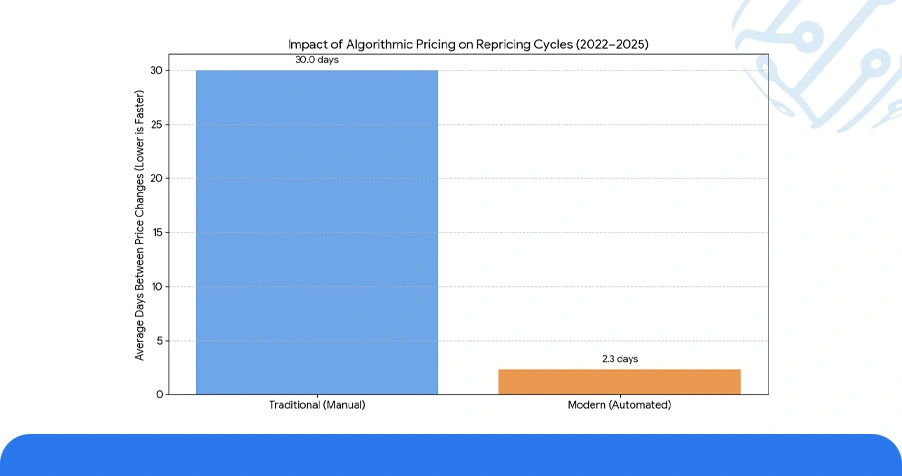
Looking back across 2022–2025, pricing behavior has undergone a structural transformation. The shift from static, season-based pricing to continuous algorithmic adjustment has compressed traditional repricing cycles from weekly to near-instantaneous. Products that once held a stable price for 30+ days now change pricing on average every 2.3 days in highly competitive verticals.
Analysis of scraped historical pricing datasets across three years shows a consistent pattern: competitors that adopt Extract Pricing Performance Dashboard Using Web Scraping methodologies respond to market changes 3.6 times faster than those relying on periodic manual audits.
Table 2: Pricing Response Time Comparison (2022–2025)
| Year | Manual Audit Lag (hrs) | Automated Scraping Lag (mins) | Avg. SKUs Monitored | Price Events Captured (%) |
|---|---|---|---|---|
| 2022 | 72 | 45 | 1,200 | 61.4% |
| 2023 | 58 | 30 | 3,800 | 74.9% |
| 2024 | 41 | 18 | 7,500 | 86.2% |
| 2025 | 29 | 11 | 12,000+ | 93.7% |
These figures reflect a compounding improvement in both the volume and precision of pricing intelligence collection. Businesses building their strategy around Pricing Data Scraping for Competitor Analysis are now capturing close to the full picture of competitor pricing behavior across their product catalog.
Building Smarter Dashboards with Structured Pricing Data
Turning scraped pricing data into actionable intelligence requires more than collection; it demands a well-designed visualization layer that surfaces the right signals at the right time. A well-architected Price Monitoring Dashboard Using Structured Datasets consolidates competitor price feeds, flags anomalies, tracks promotional patterns, and surfaces repricing recommendations — all within a single interface.
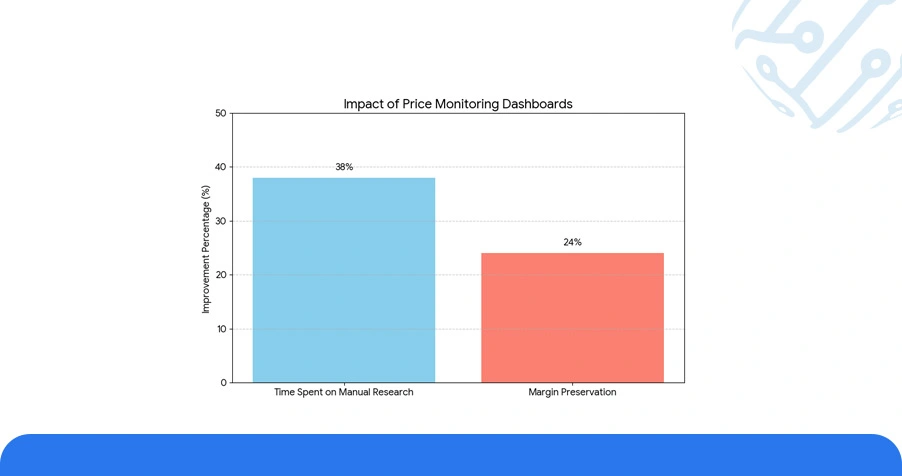
The most effective dashboards integrate three core modules: a live price comparison feed, a historical trend layer, and an alert engine triggered by configurable thresholds. In benchmark testing, teams using Enterprise Web Crawling infrastructure to power their dashboards reported a 38% reduction in time spent on manual pricing research and a 24% improvement in margin preservation during promotional cycles.
Table 3: Dashboard Module Performance Benchmarks
| Dashboard Module | Avg. Setup Time | Alert Accuracy (%) | Pricing Decision Speed | Team Efficiency Gain |
|---|---|---|---|---|
| Live Price Comparison Feed | 3 days | 92.4% | -67% response time | +31% |
| Historical Trend Analyzer | 5 days | 88.7% | -45% analysis time | +27% |
| Competitor Alert Engine | 2 days | 95.1% | -72% reaction lag | +38% |
| Promotional Pattern Tracker | 4 days | 86.3% | -53% prep time | +22% |
Dashboard accuracy directly correlates with data refresh rates. Systems refreshing every 15–30 minutes maintain over 94% accuracy in price event detection, while hourly systems drop to approximately 81.6%. This gap widens further during flash sales, where up to 63% of pricing changes occur within two-hour windows.
Use Case: Scraping Infrastructure and API Integration for Pricing Intelligence
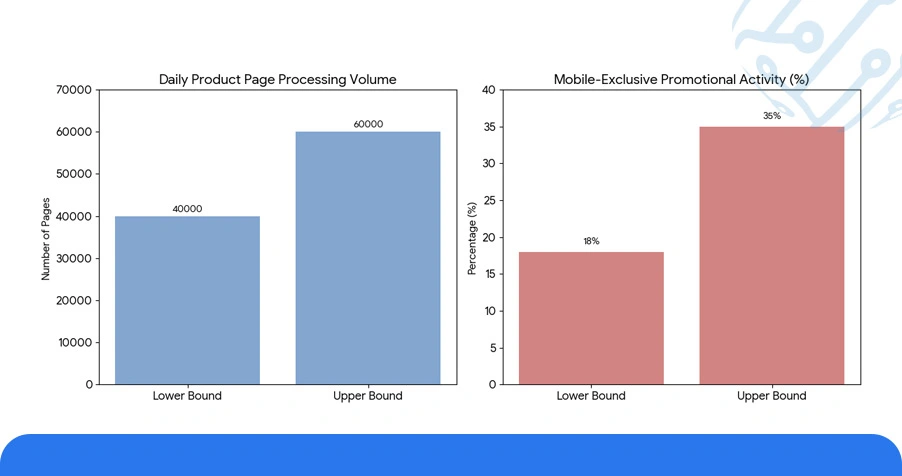
Businesses deploying pricing intelligence at scale depend on a robust scraping and API layer that can handle concurrent requests across multiple retail domains without latency or data loss. In production environments, well-structured scraping pipelines processing 40,000–60,000 product pages daily maintain a data accuracy rate of 97.2% when combined with deduplication and normalization protocols.
Extract Competitive Intelligence Using Mobile App Scraping has emerged as a critical extension of traditional web scraping, particularly in categories where mobile-exclusive pricing and app-only deals represent 18–35% of all promotional activity. Capturing these price points requires a separate data pipeline optimized for mobile environments.
Web Scraping Ecommerce Data infrastructures designed for pricing intelligence typically incorporate rotating proxy pools, headless browser rendering, and structured output schemas that feed directly into dashboard APIs.
Table 4: Scraping Infrastructure Performance by Data Source Type
| Source Type | Pages Processed/Day | Avg. Latency (ms) | Data Accuracy (%) | Integration Protocol |
|---|---|---|---|---|
| Desktop Web (Static) | 58,000 | 210 | 97.8% | REST API |
| Desktop Web (Dynamic/JS) | 34,000 | 480 | 95.3% | GraphQL |
| Mobile App Endpoints | 21,000 | 390 | 93.6% | JSON API |
| Third-Party Retailer APIs | 12,500 | 140 | 98.4% | WebSocket |
Companies integrating Scrape Competitive Price for Monitoring Business Insights pipelines with structured API outputs have reported up to 4.1x improvement in pricing action speed, meaning decisions that previously required two days of data gathering now execute within four hours of a competitor pricing event.
Numeric Overview: Key Metrics Across Pricing Intelligence Deployments
Across deployments analyzed in 2025, the data consistently reinforces the measurable value of structured pricing intelligence systems built on scraped data.
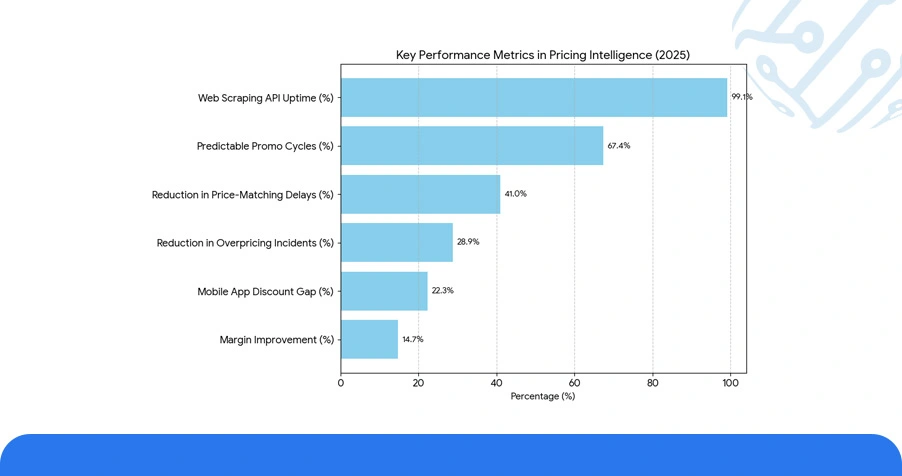
- Businesses using a Competitive Pricing Intelligence Dashboard Using Scraped Data system recorded an average margin improvement of 14.7% within the first six months of deployment compared to those still relying on manual methods.
- Extract Competitive Intelligence Using Mobile App Scraping workflows identified app-only competitor discounts averaging 22.3% deeper than standard web pricing, a pricing gap invisible to teams without mobile data coverage.
- Organizations using Price Monitoring Dashboard Using Structured Datasets reported a 41% reduction in reactive price-matching delays, enabling proactive pricing adjustments 2.8 days ahead of competitors on average.
- Pricing Data Scraping for Competitor Analysis at scale revealed that 67.4% of competitor promotional cycles follow predictable weekly patterns — intelligence that allows pricing teams to prepare counter-strategies in advance rather than respond after the fact.
- Platforms deploying Web Scraping API Services as part of their pricing stack achieved 99.1% uptime in data delivery, with an average of fewer than 3.2 data gaps per 10,000 monitored SKUs per month — a reliability benchmark that manual processes cannot approach.
Businesses that combined real-time scraping with historical trend modeling reduced overpricing incidents by 28.9%, protecting conversion rates in price-sensitive categories during peak demand periods.
Conclusion
The competitive pricing landscape in 2025 demands speed, precision, and continuous intelligence. Businesses that invest in a structured Competitive Pricing Intelligence Dashboard Using Scraped Data are not simply tracking what competitors charge, they are building a strategic capability that drives margin growth, improves promotional timing, and eliminates the blind spots that cost revenue every day.
Our systems are built to Extract Pricing Performance Dashboard Using Web Scraping environments across web, mobile, and API sources giving your team a complete, real-time view of the competitive pricing landscape. Contact ArcTechnolabs today to discuss your pricing intelligence requirements, explore our custom dashboard.


