Introduction
The global beauty and personal care market has entered a data-first phase, where every trend, ingredient, and price point can now be analyzed using structured datasets. The Cosmetic Product API Dataset 2025 emerges as a critical asset for brands, marketplaces, and analysts aiming to decode evolving consumer behaviors. With rising demand for transparency, sustainability, and affordability, understanding product-level data across beauty stores and platforms is key to gaining a competitive edge.
This report uncovers valuable insights from the dataset—covering emerging ingredients, pricing trends, consumer ratings, and platform-based product distributions—using data collected through Web Scraping Services, API integrations, and mobile app sources across major cosmetic eCommerce platforms globally.
Trends in Online Cosmetic Marketplaces (2020–2025)
-01.webp)
The Cosmetic Product API Dataset 2025 reveals that the online cosmetic retail sector has grown steadily post-pandemic, with increased demand for skincare, clean beauty, and gender-neutral products. Scraped data from top beauty eCommerce sites reflects real-time availability, popularity scores, and new launches.
Marketplace Growth (2020–2025)
| Year | Global Online Cosmetics Revenue (USD Billion) | YoY Growth % |
|---|---|---|
| 2020 | 39.1 | — |
| 2021 | 44.6 | 14.1% |
| 2022 | 51.0 | 14.4% |
| 2023 | 59.7 | 17.1% |
| 2024 | 66.8 | 11.9% |
| 2025 | 72.4 (est.) | 8.3% |
By using Web Scraping API for Cosmetic Products, businesses access live trend data that includes category-wise launches, seasonal availability, and ingredient-based product tagging. This dataset empowers strategy teams to monitor what's gaining traction and what’s fading from the market, in real time.
The E-Commerce Cosmetics Dataset for 2025 shows a rise in direct-to-consumer (D2C) product listings, with more brands skipping traditional retailers and integrating with multi-brand platforms like Sephora and Nykaa.
Ingredient Usage Analysis Across Products
Ingredient-level transparency has become a key decision factor for consumers in 2025. The Cosmetic Product API Dataset 2025 helps uncover which ingredients are trending and how their frequency has evolved across SKUs.
Ingredient Usage Analysis Across Products
Ingredient-level transparency has become a key decision factor for consumers in 2025. The Cosmetic Product API Dataset 2025 helps uncover which ingredients are trending and how their frequency has evolved across SKUs.
Ingredient Frequency – Top Trends (2020–2025)
| Ingredient | 2020 Usage % | 2025 Usage % | Change (%) |
|---|---|---|---|
| Niacinamide | 24% | 48% | +100% |
| Hyaluronic Acid | 33% | 61% | +85% |
| Retinol | 18% | 27% | +50% |
| Vitamin C | 26% | 42% | +61.5% |
| Parabens | 22% | 9% | -59% |
Using our Web Scraping ECommerce Data , we monitored thousands of products across global retailers and observed a strong move toward "clean beauty" ingredients. The data also reveals the drop in harmful or controversial additives and the rise of biodegradable and plant-based alternatives.
With Mobile App Scraping Services , ArcTechnolabs enables collection of ingredient disclosures that are app-only or embedded deep within product descriptions, ensuring holistic data for formulation analysts and R&D teams.
Cosmetic Pricing Intelligence (2020–2025)
Price optimization in cosmetics is a moving target. From luxury serums to budget-friendly lipsticks, brands must continually monitor market pricing to stay competitive. The Cosmetic Product API Dataset 2025 supports this need by offering granular, real-time price data.
Average Price by Product Category (Global, 2020–2025)
| Category | 2020 ($) | 2023 ($) | 2025 Est. ($) |
|---|---|---|---|
| Foundation | 21.5 | 25.2 | 26.8 |
| Lipstick | 12.3 | 14.7 | 15.5 |
| Eye Shadow Palettes | 19.8 | 23.6 | 24.1 |
| Moisturizer | 18.2 | 22.4 | 23.9 |
| Facial Serums | 28.5 | 34.8 | 36.4 |
Our Makeup Pricing Intelligence Dataset helps brands identify overpricing, underpricing, and bundle strategies. Using Extract Product Ratings from Beauty Stores, clients also correlate price with user sentiment, aiding in demand forecasting and discount planning.
ArcTechnolabs delivers this data via clean dashboards, enriched Cosmetic eCommerce Dataset 2025, and real-time alerts to help brands adjust pricing dynamically.
Regional and Channel Distribution of Cosmetic Products
The dataset highlights variations in product availability and popularity based on country, retailer, and delivery model (direct vs. third-party). ArcTechnolabs used its Web Scraping API Services to gather product-level data across 20+ global marketplaces and mobile apps.
Regional SKU Count Distribution – 2025
| Region | No. of Unique SKUs | Most Popular Category |
|---|---|---|
| North America | 18,300 | Skincare |
| Europe | 14,500 | Makeup |
| Asia-Pacific | 20,200 | Whitening Products |
| Middle East | 8,700 | Fragrance & Perfumes |
This cross-market data was collected using automated systems designed to Scrape Cosmetic Products for 2025 Dataset across top apps and web platforms.
By unifying all this data into an E-Commerce Dataset, we help brands visualize their product presence across channels—detecting supply gaps, regional interests, and untapped opportunities.
Consumer Ratings & Sentiment Trends (2020–2025)
Analyzing product ratings offers a clear lens into consumer satisfaction and market performance. With the Cosmetic Product API Dataset 2025, ArcTechnolabs enabled brands to extract product ratings from beauty stores, revealing shifts in user perception across categories and price tiers.
Average Rating by Product Type (2020–2025)
| Product Type | 2020 Avg. Rating | 2023 Avg. Rating | 2025 Est. Avg. Rating |
|---|---|---|---|
| Lipsticks | 4.1 | 4.3 | 4.4 |
| Foundations | 3.8 | 4.2 | 4.3 |
| Serums | 4.0 | 4.5 | 4.6 |
| Sunscreens | 3.6 | 4.0 | 4.1 |
| Eye Shadows | 4.2 | 4.4 | 4.5 |
The dataset provides store-specific sentiment tags, verified reviews, and star breakdowns. When integrated with other modules of the E-Commerce Cosmetics Dataset for 2025, it helps measure how product reformulations or relaunches influence customer perception over time.
Through Web Scraping API Services, ArcTechnolabs fetches real-time consumer feedback across desktop, mobile apps, and regional variants.
Discount and Bundle Analysis by Retailer
In the hyper-competitive cosmetic space, pricing alone isn’t enough. Promotions and bundling drive sales—and understanding which retailers push the most aggressive offers is key.
Using the Cosmetic Product API Dataset 2025, ArcTechnolabs tracked discount patterns across major retailers and extracted daily offers using automated Web Scraping Services.
Promotion Frequency by Platform (2025)
| Retailer | % of Products on Sale | Avg. Discount (%) | Most Bundled Category |
|---|---|---|---|
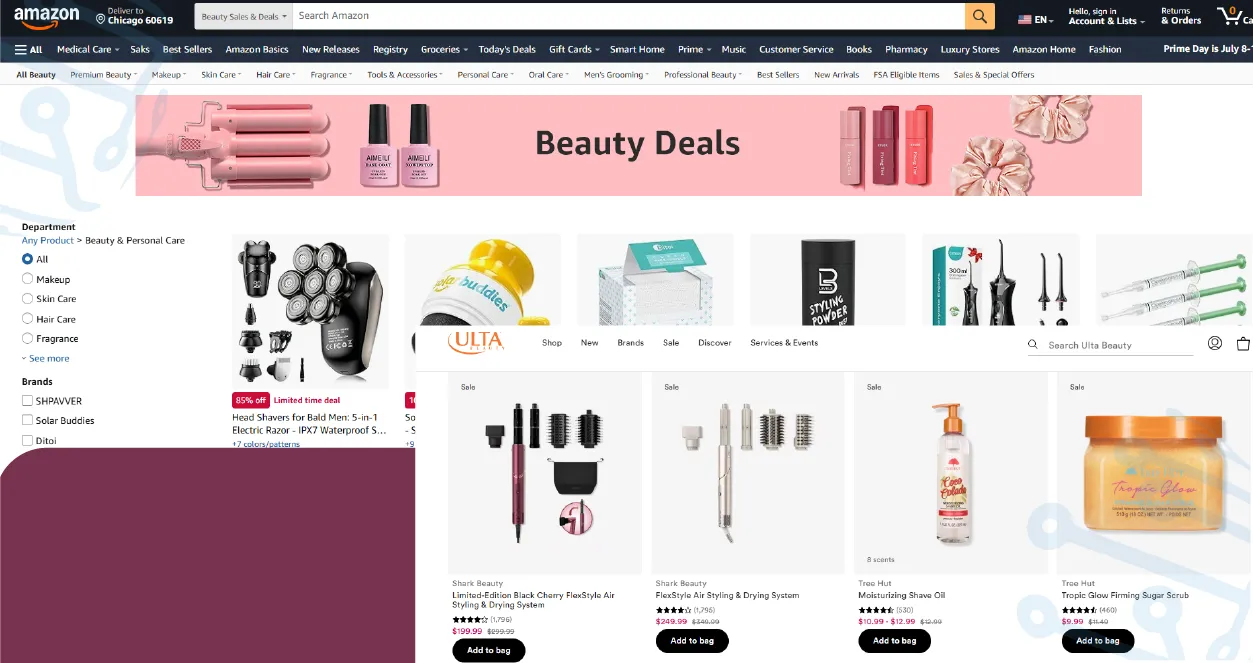
| Amazon Beauty | 47% | 18% | Lipsticks |
| Ulta | 61% | 22% | Serums |
| Sephora | 38% | 15% | Foundations |
| Nykaa (India) | 56% | 25% | Moisturizers |
| Lookfantastic UK | 40% | 19% | Hair Masks |
By leveraging Web Scraping ECommerce Data, ArcTechnolabs enabled clients to monitor these promotional shifts and adjust marketing tactics accordingly.
This also helped create the Makeup Pricing Intelligence Dataset, which segments price + promo behavior by brand, platform, and month.
Mobile App vs Web Pricing Variance
A growing number of retailers offer exclusive mobile-only deals. To stay truly competitive, brands must monitor both web and app pricing. ArcTechnolabs used Mobile App Scraping Services to compare listings across platforms, creating the Cosmetic eCommerce Dataset 2025 enriched with platform-specific pricing intelligence.
Web vs App Price Gap (2025)
| Product Category | Avg. Web Price ($) | Avg. App Price ($) | Difference (%) |
|---|---|---|---|
| Serums | 36.4 | 34.5 | -5.2% |
| Lipsticks | 15.5 | 14.2 | -8.4% |
| Moisturizers | 23.9 | 22.1 | -7.5% |
| Foundations | 26.8 | 25.4 | -5.2% |
| Eye Shadows | 24.1 | 23.0 | -4.6% |
Retailers like Nykaa, Sephora, and Amazon Beauty offer steeper discounts or flash sales on mobile—data that is often missed in standard desktop scrapes. With Scrape Cosmetic Products for 2025 Dataset, we help brands stay updated on every channel's pricing shifts.
Product Launch Monitoring by Brand
Tracking new product rollouts helps brands benchmark innovation velocity. Using the Cosmetic Product API Dataset 2025, ArcTechnolabs compiled SKU creation dates, launch categories, and region-wise brand penetration from over 100 global and regional beauty brands.
Product Launches by Brand (2024–2025)
| Brand | New SKUs (2024) | New SKUs (2025) | Top Category |
|---|---|---|---|
| L'Oréal Paris | 68 | 77 | Haircare |
| Maybelline | 42 | 58 | Lipsticks |
| The Ordinary | 24 | 31 | Serums |
| MAC Cosmetics | 33 | 40 | Foundations |
| Nykaa Cosmetics | 54 | 63 | Moisturizers |
Combining this data with the E-Commerce Datasets allows competitive teams to align innovation efforts with market timing and consumer trends.
Conclusion
The Cosmetic Product API Dataset 2025 delivers unmatched clarity into the beauty ecosystem. From tracking ingredients and sentiment to monitoring platform-specific pricing, ArcTechnolabs empowers brands, retailers, and researchers with accurate, actionable insights.
Whether you're looking to optimize pricing, monitor new launches, or decode customer sentiment—Web Scraping Services, API delivery, and mobile app coverage from ArcTechnolabs turn raw data into real results.
Need ready-to-integrate cosmetic product datasets? Contact ArcTechnolabs today to unlock 2025's most powerful beauty data advantage.


