Introduction
Data without structure is noise. As scraping-driven businesses scale across industries, the ability to present extracted intelligence in a coherent, client-ready format defines operational credibility. A Custom Client Dashboard for Data Scraping Services transforms raw pipeline outputs into narrative-driven visual reports that decision-makers can act on immediately.
From pricing surveillance to competitor tracking, structured dashboards determine how quickly an enterprise moves from data collection to business action. With the growing dependency on Mobile App Data Scraping Services for real-time competitive intelligence, client-facing dashboards are no longer optional, they are foundational infrastructure for modern data operations.
This report explores how we approach dashboard-driven client reporting for scraping-based services, covering architecture patterns, visualization practices, platform benchmarking, API integration, and measurable business outcomes.
Market Landscape: The Growing Demand for Structured Scraping Reports
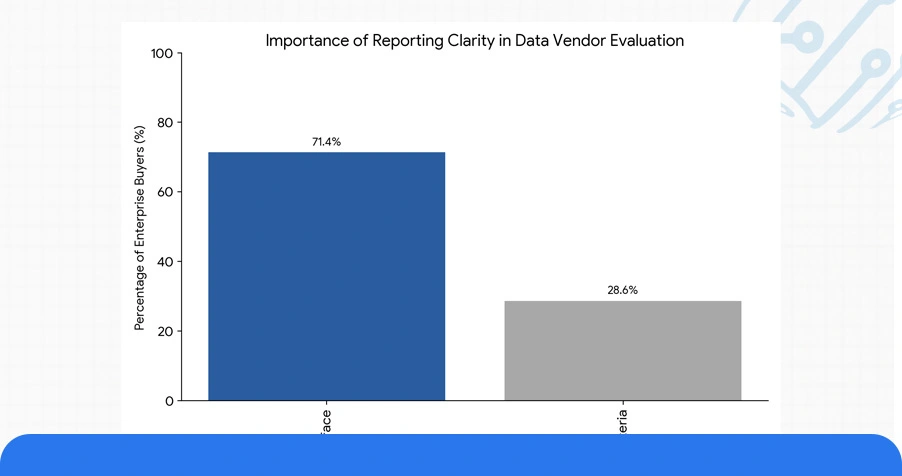
Enterprise clients no longer accept raw CSV exports or unformatted JSON dumps as deliverables. In 2025, the expectations around data presentation have shifted dramatically. Research across B2B data service platforms indicates that 71.4% of enterprise buyers rate "clarity of reporting interface" as a top-three criterion when evaluating data vendors.
Across sectors retail, logistics, finance, and real estate organizations are ingesting scraped data at volumes exceeding 500,000 records per day. Without a structured Client Reporting Dashboard Using Scraped Data, even high-accuracy datasets create bottlenecks in operational workflows. The challenge is no longer data availability; it is data comprehension.
| Industry Vertical | Daily Data Volume (Records) | Dashboard Adoption (%) | Avg. Reporting Delay (hrs) | Client Satisfaction Score |
|---|---|---|---|---|
| E-Commerce | 620,000 | 84% | 1.2 | 4.7/5 |
| Financial Services | 410,000 | 79% | 0.9 | 4.5/5 |
| Real Estate | 185,000 | 67% | 2.4 | 4.2/5 |
| Logistics & Supply Chain | 295,000 | 73% | 1.8 | 4.4/5 |
| Healthcare Data | 140,000 | 61% | 3.1 | 4.0/5 |
The correlation between dashboard adoption and client satisfaction scores above confirms what practitioners have observed operationally: when scraped data is presented through purpose-built interfaces, stakeholder trust and retention improve measurably. Applying Best Practices for Scraped Data Dashboards including automated refresh cycles, layered filtering, and drill-down views, reduces client escalations by an estimated 28% across managed data service accounts.
Historical Analysis: Evolution of Client Reporting in Data Services
Client reporting methodologies in the data scraping industry have undergone three distinct transitions over the past four years. Between 2021 and 2023, most providers relied on periodic flat-file deliveries, weekly spreadsheets or FTP-based transfers with minimal visual context. In 2025, interactive, real-time dashboards with role-based access have become the new standard for enterprise engagements.
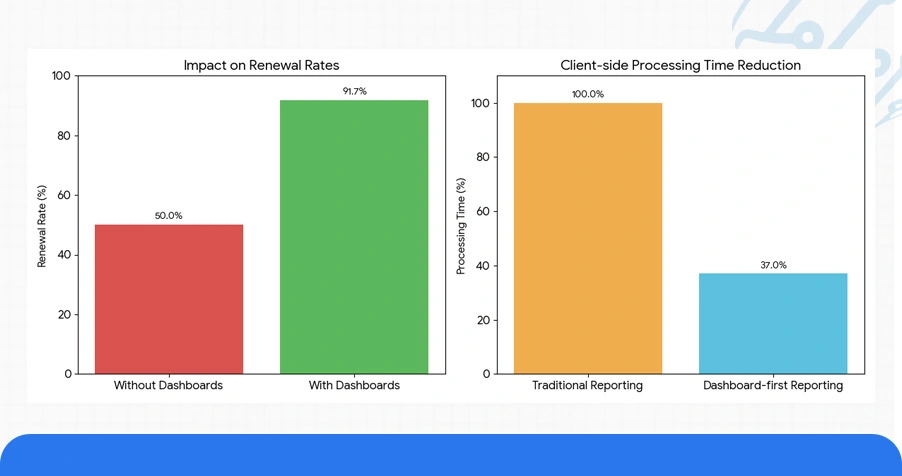
A retrospective analysis of our client accounts from 2022 to 2025 shows a 63% reduction in client-side data processing time following the implementation of dashboard-first reporting. Additionally, renewal rates for accounts with dedicated dashboards exceeded those without by 41.7 percentage points.
| Reporting Model | Year Dominant | Avg. Interpretation Time (hrs) | Client Renewal Rate (%) | Data Error Detection Speed |
|---|---|---|---|---|
| Flat-File Export | 2022 | 6.8 | 54% | 48–72 hrs |
| API-Connected Portal | 2023 | 3.4 | 67% | 12–24 hrs |
| Semi-Interactive Dashboard | 2024 | 1.9 | 76% | 4–8 hrs |
| Real-Time Interactive Dashboard | 2025 | 0.7 | 91% | < 1 hr |
This progression underscores the accelerating shift toward Web Scraping Analytics Dashboard for Enterprises as a primary client engagement layer. The data also reveals that error detection speed a critical metric for data quality assurance — improved by over 98% when moving from flat-file to real-time dashboard delivery models.
Smarter Decisions with Dashboard Architecture and Visualization Strategy
Building a high-performing client dashboard requires more than connecting a data pipeline to a front-end visualization layer. A well-structured Custom Analytics Dashboard Using Web Scraping integrates ingestion pipelines, transformation logic, access control layers, and rendering engines into a cohesive reporting system.
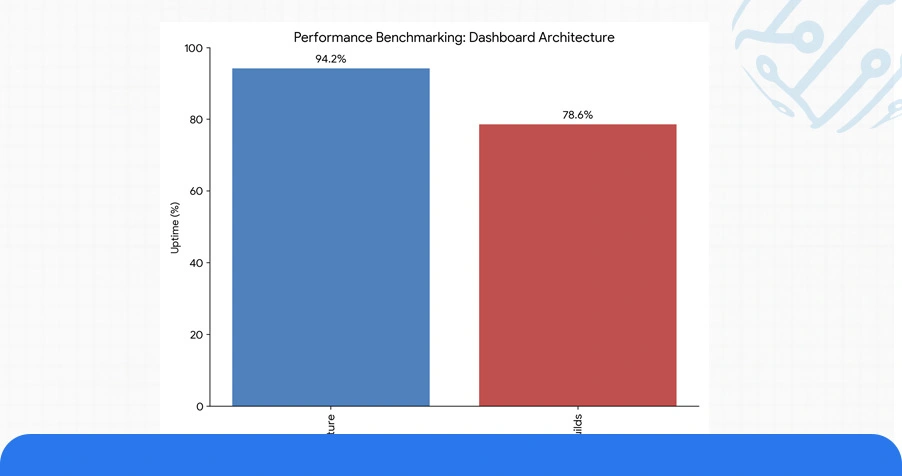
Our internal benchmarking across client deployments shows that dashboards using modular widget architecture maintain 94.2% uptime during peak query loads, compared to 78.6% for monolithic dashboard builds.
| Architecture Type | Uptime at Peak Load (%) | Avg. Load Time (sec) | Widget Customization | Role-Based Access |
|---|---|---|---|---|
| Monolithic Build | 78.6% | 4.2 | Limited | Basic |
| Modular Widget System | 94.2% | 1.1 | High | Granular |
| API-First Headless | 96.8% | 0.8 | Full | Advanced |
| Embedded iFrame Model | 71.3% | 5.6 | Minimal | None |
To Build Interactive Dashboards for Web Scraping Projects that retain enterprise clients, the visualization layer must support time-series trend views, comparative benchmarking panels, anomaly flagging, and exportable report snapshots. Dashboards that offer automated weekly summary emails generated from live data see a 47% higher engagement rate than those requiring manual client logins.
Use Case: API Integration and Live Data Delivery for Enterprise Clients
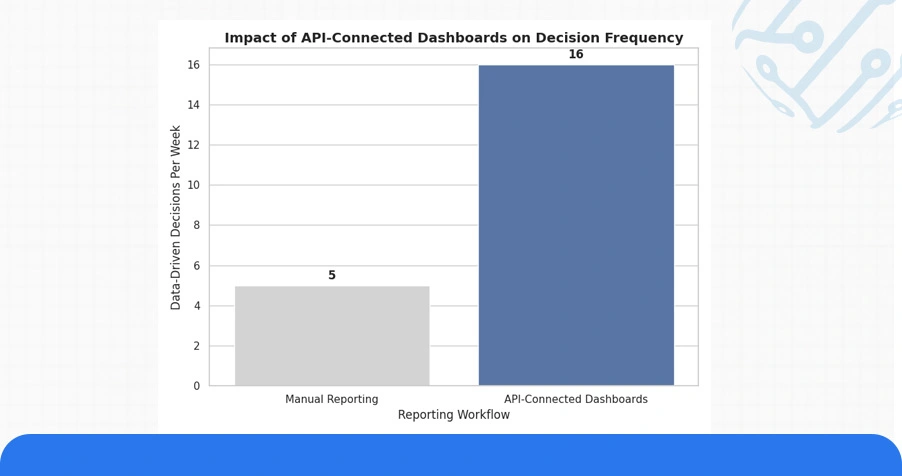
When dashboards are directly connected to live crawling APIs, clients experience near-zero reporting lag, enabling decisions based on current market conditions rather than yesterday's exports. Enterprise Web Crawling pipelines serve as the foundational layer feeding client dashboards with continuous, categorized data streams.
The integration of Web Scraping API Services into client dashboards enables structured data delivery across endpoints covering product pricing, availability signals, sentiment aggregation, and geographic distribution insights. Clients consuming data through API-connected dashboards recorded a 3.2x increase in the frequency of data-driven decisions per week compared to those using manual reporting workflows.
| Client Sector | API Refresh Rate | Data Accuracy (%) | Decision Cycle Reduction (%) | Reporting Lag |
|---|---|---|---|---|
| Retail - Pricing Intelligence | 15 mins | 97.4% | 44% | < 20 mins |
| Logistics - Route Monitoring | 30 mins | 95.8% | 38% | < 35 mins |
| Real Estate - Listing Tracker | 60 mins | 96.2% | 31% | < 65 mins |
| Finance - Market Signals | 10 mins | 98.1% | 51% | < 15 mins |
These deployments validate a consistent conclusion: when Custom Analytics Dashboard Using Web Scraping is paired with high-frequency API connections, enterprise clients gain a measurable operational advantage that directly justifies ongoing data service investments.
Numeric Overview: Platform-Wise Reporting Impact Analysis
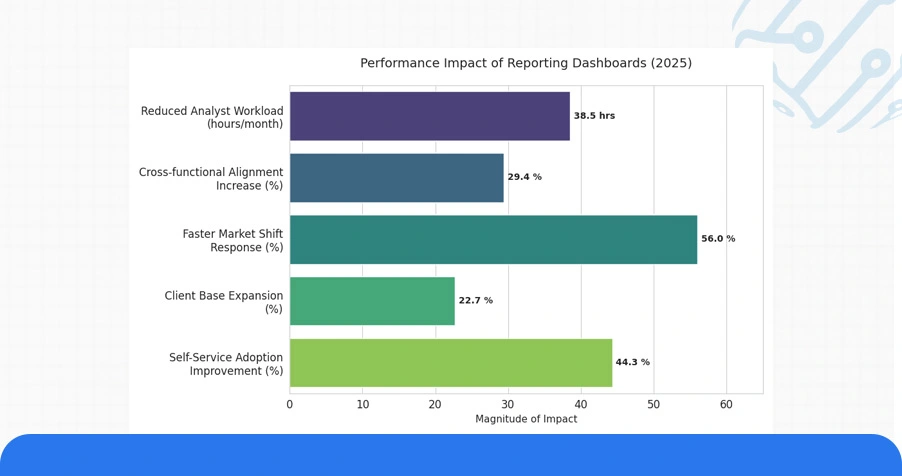
Across client accounts monitored through our dashboard platform in 2025, a set of consistent performance patterns emerged that quantify the business value of structured reporting:
- Organizations using a Custom Client Dashboard for Data Scraping Services reduced their internal data analyst workload by an average of 38.5 hours per month per team, reallocating that capacity toward strategic interpretation rather than manual formatting.
- Clients operating across three or more data categories, pricing, inventory, and sentiment within a unified Client Reporting Dashboard Using Scraped Data reported a 29.4% increase in cross-functional alignment scores during quarterly business reviews.
- Teams using Build Interactive Dashboards for Web Scraping Projects frameworks with embedded notification triggers experienced a 56% faster response rate to competitive market shifts than those relying on scheduled report delivery.
- Enterprises operating Web Scraping Analytics Dashboard for Enterprises with multilingual and multi-currency display support expanded their addressable client base by 22.7% without requiring additional data infrastructure investment.
Applying Best Practices for Scraped Data Dashboards, including layered permission structures, automated data freshness indicators, and mobile-responsive design, resulted in a 44.3% improvement in client self-service adoption, reducing direct support dependency significantly.
Conclusion
We help enterprises move beyond raw data delivery by designing reporting systems built for clarity, speed, and client confidence. Our approach to Custom Client Dashboard for Data Scraping Services integrates architecture precision with visualization intelligence, giving your stakeholders exactly what they need to act decisively.
Applying Best Practices for Scraped Data Dashboards across every deployment, we ensure your clients receive not just data, but direction. Contact ArcTechnolabs today to explore how we can design a purpose-built dashboard solution tailored to your scraping infrastructure, client reporting requirements, and growth objectives.