Introduction
Retail pricing in the digital era is no longer driven by intuition, it is shaped by algorithms, consumer behavior data, and platform-wide demand signals that shift hourly. For businesses operating across online marketplaces, maintaining competitive pricing requires more than periodic checks; it demands a structured intelligence system.
Advancing digital retail strategy with E-Commerce Price Monitoring for Retail Businesses to support market benchmarking and more responsive pricing strategies has become a baseline expectation for modern retailers. By analyzing millions of product listings across platforms like Amazon, Walmart, and Flipkart, this report uncovers how pricing volatility, competitive gaps, and demand-driven fluctuations influence revenue outcomes.
Through the integration of Ecommerce Data Scraping Services, retailers can now track competitor pricing movements at scale, enabling faster decisions across product categories, geographies, and customer segments.
Market Landscape: Variability of Online Retail Pricing Patterns
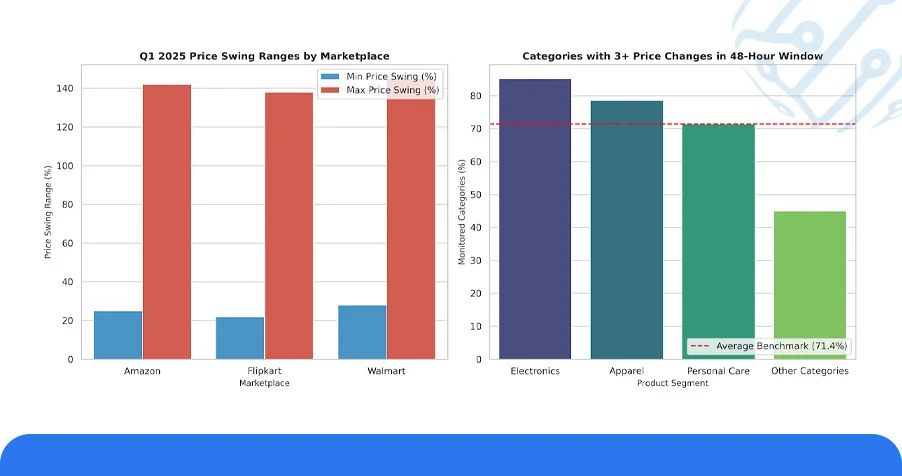
As of 2025, the online retail pricing environment across leading marketplaces has become measurably more volatile compared to pre-2023 norms. An analysis of Q1 2025 cross-category listings across Amazon, Flipkart, and Walmart reveals price swings ranging from 22% to over 140% within condensed timeframes, driven primarily by algorithmic repricing tools and real-time inventory signals.
Competitor Price Data Scraping for E-Commerce has emerged as a critical function for retailers attempting to decode these rapid adjustments. Nearly 71.4% of monitored product categories recorded three or more price changes within a 48-hour window, particularly in electronics, apparel, and personal care segments.
Table 1: Weekly Price Fluctuation Rate Across Top Product Categories
| Product Category | Avg. Weekly Price ($) | Price Variance (%) | Platform | Price Updates (48h) |
|---|---|---|---|---|
| Smartphones | 485 | 31% | Amazon | 6 |
| Running Footwear | 112 | 24% | Walmart | 4 |
| Skincare Sets | 68 | 27% | Flipkart | 5 |
| Home Appliances | 340 | 33% | Amazon | 7 |
| Laptop Accessories | 95 | 21% | Walmart | 3 |
This increasing variability reinforces the strategic value of reliable E-Commerce Product Price Tracking, enabling retail businesses to design more agile pricing responses and protect margin integrity across high-competition segments.
Historical Analysis of Retail Price Movements
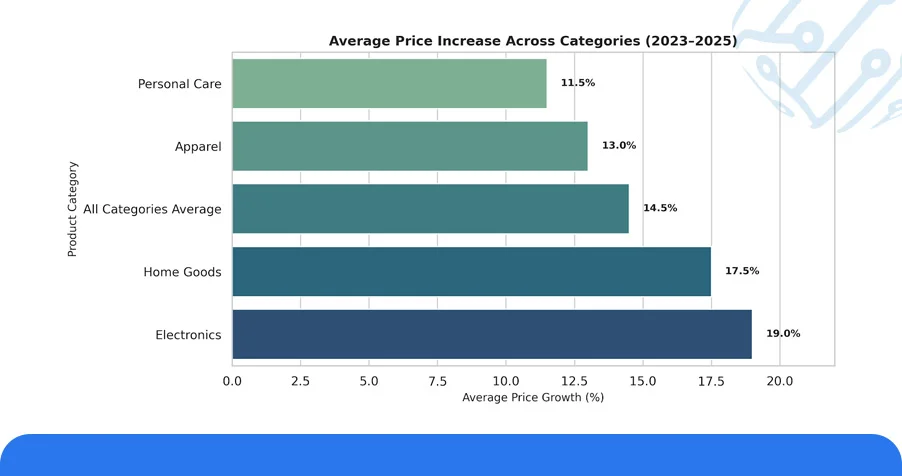
A structured review of retail pricing data from 2023 to 2025 shows a steady rise in base prices and price revisions across major e-commerce platforms. E-Commerce Dataset analysis indicates that average prices in leading categories increased by 10–19%, with electronics and home goods showing the sharpest growth.
This trajectory aligns with the broader adoption of machine-learning-based pricing engines, where platforms dynamically adjust product prices based on session data, search volume, and competitor positioning. The Retail Pricing Dataset for Competitive Analysis has proven critical for isolating these patterns and building accurate forecasting models.
Table 2: Historical Average Selling Price Comparison by Category (2023–2025)
| Product Category | Avg. Price 2023 ($) | Avg. Price 2024 ($) | Avg. Price 2025 ($) | % Change (2023–2025) |
|---|---|---|---|---|
| Wireless Earbuds | 58 | 65 | 71 | +22.4% |
| Smartwatches | 145 | 162 | 178 | +22.7% |
| Kitchen Blenders | 74 | 81 | 87 | +17.5% |
| Yoga Mats | 38 | 42 | 46 | +21.0% |
| Desk Chairs | 210 | 228 | 244 | +16.1% |
This three-year view reinforces the urgency for retailers to invest in continuous E-Commerce Product Price Tracking solutions. By applying regression-based models and historical pricing datasets, analysts can now predict seasonal spikes, promotional windows, and competitor markdowns with significantly greater accuracy, an advantage that directly translates into improved sell-through rates and stronger margins.
Smarter Decisions with Predictive Tools and Dashboards
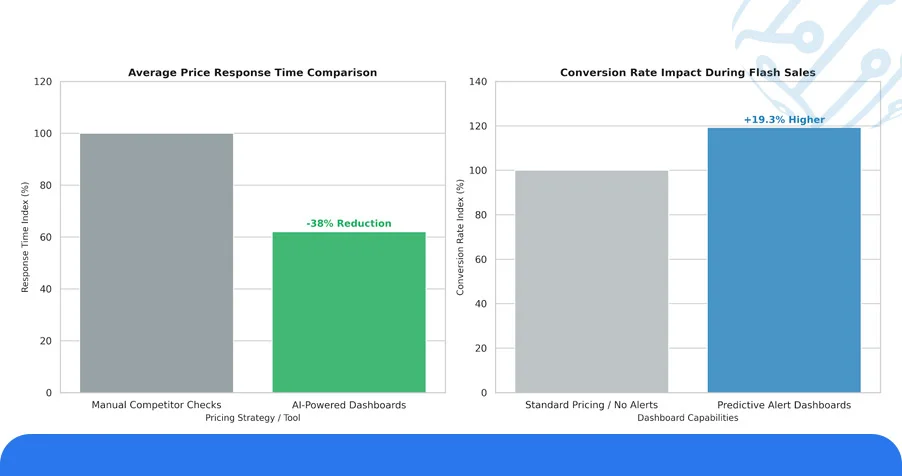
The role of AI-powered pricing dashboards in modern retail strategy has expanded considerably over the past two years. These platforms aggregate competitor pricing, demand signals, and historical trends into unified interfaces that enable faster, more informed decisions by category managers and pricing teams.
Retailers leveraging E-Commerce Price Monitoring for Retail Businesses through integrated dashboard systems reported an average price response time reduction of 38%, compared to teams relying on manual competitor checks. Notably, platforms with predictive alert features helped retailers capture up to 19.3% higher conversion rates during flash sale windows by aligning promotional pricing within minutes of competitor drops.
The demand for Competitor Price Data Scraping for E-Commerce has also accelerated dashboard evolution, pushing vendors to offer granular category-level breakdowns, historical price overlays, and real-time competitor benchmarks within a single view.
Table 3: Dashboard Performance Benchmarks Across Retail Intelligence Platforms
| Platform | Pricing Engine | Forecast Accuracy (%) | Avg. Margin Uplift (%) | Data Refresh Rate |
|---|---|---|---|---|
| PriceLens Pro | ML-Adaptive v3 | 92% | 17.8% | Every 4 Hours |
| RetailIQ | SmartScan AI | 95% | 22.1% | Hourly |
| CompeteEdge | DynaPricer 2.0 | 88% | 15.6% | Twice Daily |
These intelligent tools have redefined how pricing teams operate, transforming the Retail Pricing Dataset for Competitive Analysis from a passive reporting resource into an active decision-making engine that drives measurable outcomes across promotional and everyday pricing cycles.
Use Case: Retail Data Extraction and API Applications
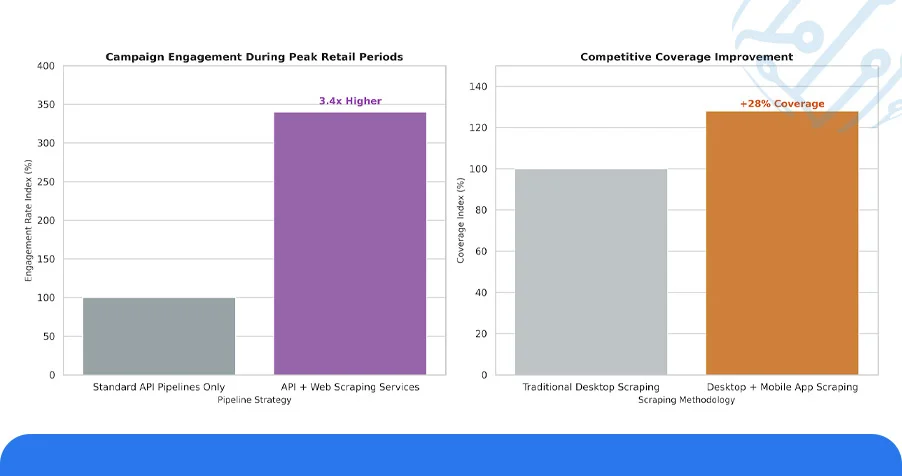
Businesses building dynamic pricing systems, affiliate commerce platforms, or retail analytics tools increasingly depend on scalable Retail Price Monitoring API infrastructure to access accurate, continuously refreshed product pricing data across multiple marketplaces.
Stress tests conducted across global retail verticals showed that hourly API-based price scans achieved a 97.2% data accuracy rate with sub-second latency on high-volume product feeds. Businesses that adopted Web Scraping Services to supplement their API data pipelines reported up to 3.4x higher campaign engagement rates during peak retail periods such as Black Friday and end-of-season sales.
Additionally, retailers using Mobile App Data Scraping Services captured pricing signals from competitor mobile listings that were invisible to traditional desktop-based scraping tools, improving competitive coverage by approximately 28%.
Table 4: Retail Price Monitoring API Performance Metrics by Region
| API Solution | Region | Accuracy Rate (%) | Data Refresh Rate | Integration Type |
|---|---|---|---|---|
| PriceStream X | Asia-Pacific | 97.2% | Hourly | REST |
| MarketPulse API | North America | 95.6% | 30 Mins | WebSocket |
| RetailFeed Pro | Europe | 96.0% | 45 Mins | GraphQL |
| ShelfSight API | Global | 93.4% | Hourly | JSON API |
The Retail Price Monitoring API ecosystem continues to expand, with vendors introducing SKU-level granularity, multi-currency support, and cross-platform comparison features that significantly elevate the quality of E-Commerce Product Price Tracking for enterprise and mid-scale retailers alike.
Numeric Overview: Platform-Wise Pricing Fluctuation Analysis
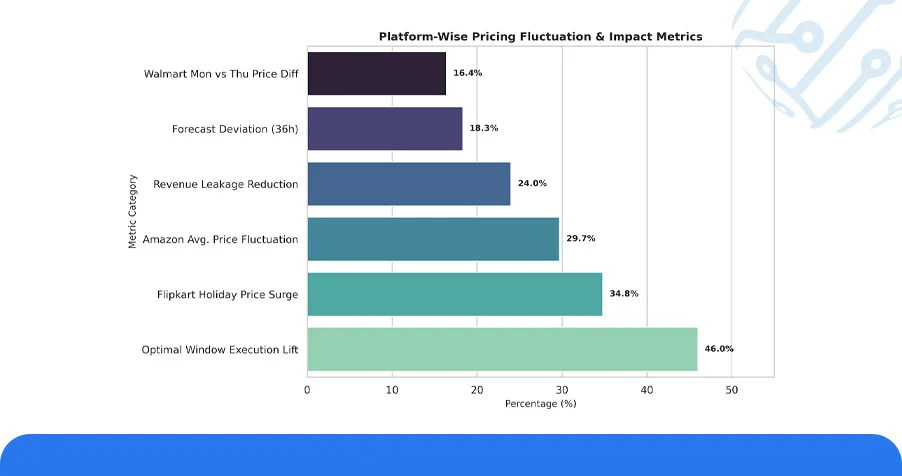
Retailers integrating AI-powered pricing dashboards with the Retail Pricing Dataset for Competitive Analysis were 46% more likely to execute price changes within the optimal conversion window.
- Amazon's 2025 pricing dataset recorded a 29.7% average price fluctuation across 18 monitored product categories, with electronics and home essentials driving the sharpest volatility peaks.
- Walmart demonstrated the highest early-week price advantage, with Monday listings averaging 16.4% lower than Thursday rates, a consistent pattern identified across 11 consecutive months.
- Flipkart's festive and regional sale segments experienced a 34.8% price surge during major holiday periods, with category-specific peaks reaching 52% in premium electronics.
- Approximately 18.3% of pricing forecast deviations occurred within 36 hours of major competitor promotional announcements, underscoring the importance of real-time monitoring coverage.
- Businesses using structured E-Commerce Price Monitoring for Retail Businesses frameworks reported a 24% reduction in revenue leakage attributed to delayed price response cycles.
SKU-level price tracking across multi-platform environments showed that product listings with three or more active competitor references experienced 2.8x faster price normalization than single-platform benchmarks.
Conclusion
In today's hyper-competitive digital retail environment, pricing decisions made on outdated data carry real costs, lost conversions, eroded margins, and diminished brand competitiveness.
Retailers that embed structured systems for E-Commerce Price Monitoring for Retail Businesses into their operational strategy are consistently better positioned to respond to market shifts, capitalize on competitor gaps, and protect profitability across all product tiers.
With demand patterns evolving faster than ever, the precision offered by a robust Retail Price Monitoring API infrastructure is no longer optional, it is foundational. Contact ArcTechnolabs today to explore how our data tools can sharpen your competitive edge and drive smarter pricing outcomes across your entire product catalog.