Introduction
Retail pricing across Europe has entered a period of unprecedented complexity, with product prices shifting multiple times daily across thousands of online storefronts. From fast-moving consumer goods in Germany to electronics in France and apparel in Italy, price gaps between competing retailers can swing by 25–45% within a single week.
In this environment, structured price intelligence has become less of a competitive advantage and more of a baseline necessity for retailers, distributors, and market analysts operating at scale. The growing adoption of European Retail Price Monitoring via Web Scraping for Analytics has fundamentally changed how businesses capture, interpret, and act on pricing data.
This report draws on aggregated datasets from major European retail corridors, covering price behavior across five key product categories and multiple geographic markets. Paired with Web Scraping Ecommerce Data infrastructure, these pipelines deliver granular pricing intelligence that drives measurable commercial outcomes.
Market Landscape: Retail Price Variability Across European Markets
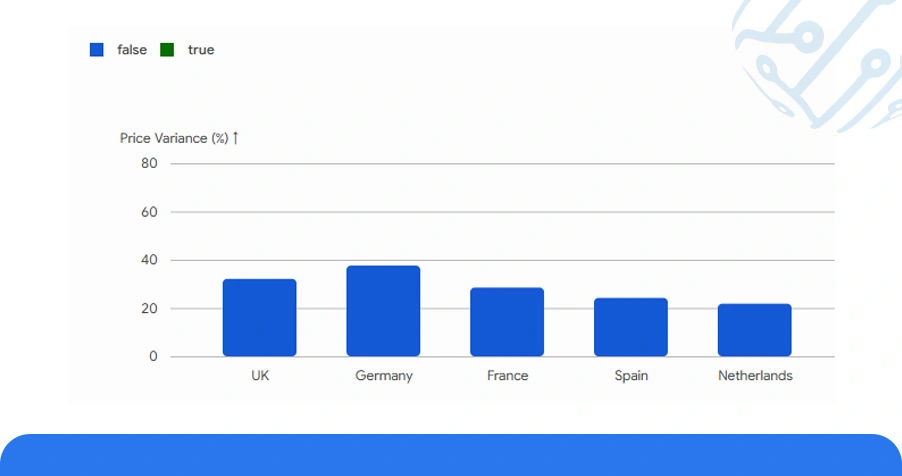
European retail markets are among the most fragmented and pricing-volatile in the world. A Q1 2025 analysis of electronics, home goods, and personal care categories across the UK, Germany, France, Spain, and the Netherlands revealed that identical SKUs carried price differences of up to 37.6% between competing platforms within the same country.
Germany stood out as the most price-dynamic market, with 71.4% of tracked product listings on major e-commerce platforms receiving at least three price updates within a 96-hour window. Smart tools to Extract Competitor Price for Analysis Across the Europe at this scale, organizations are deploying scraping architectures capable of processing millions of product records per day.
Table 1: Weekly Price Variation by Category and Market (Q1 2025)
| Market | Category | Avg. Weekly Price (€) | Price Variance (%) | Price Updates / 96h |
|---|---|---|---|---|
| Germany | Consumer Electronics | 348 | 34.2% | 6 |
| United Kingdom | Home Appliances | 212 | 29.7% | 5 |
| France | Personal Care | 87 | 22.1% | 4 |
| Spain | Apparel | 64 | 18.9% | 3 |
| Netherlands | Sports & Outdoors | 143 | 26.5% | 5 |
This level of pricing activity across five markets and multiple product verticals makes real-time intelligence a functional requirement, not an optional enhancement. The scale and speed of these fluctuations are precisely why European Retail Price Monitoring via Web Scraping for Analytics has seen adoption grow by over 58% among mid-to-large European retailers between 2023 and 2025.
Historical Trends in European Retail Pricing Patterns
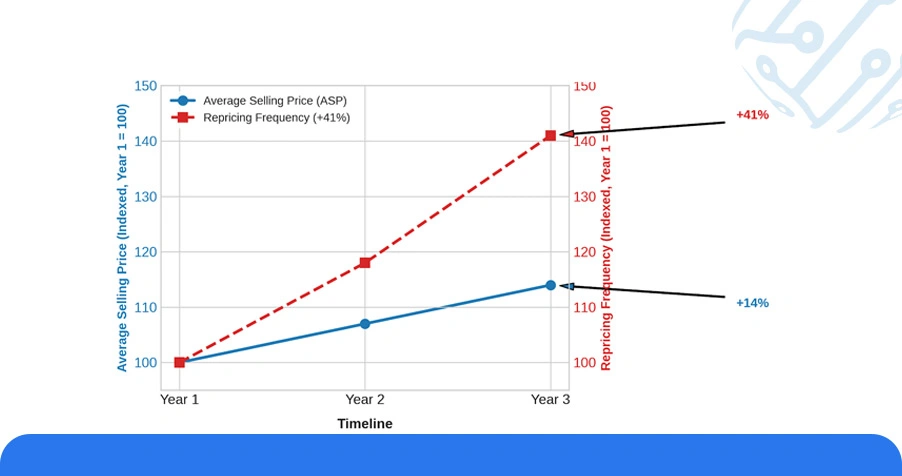
A three-year review of retail price data across core European markets shows a consistent upward drift in average selling prices, accompanied by a sharp increase in repricing frequency. More significantly, the frequency of price changes has increased by approximately 41% over the same period, according to internal dataset benchmarks.
Retailers that are not monitoring these shifts in near real-time are effectively operating on stale intelligence. Retail Competitor Intelligence Data Analytics Using API Scraping has become the primary mechanism for capturing these fast-moving signals.
Table 2: Average Selling Price Trends by Category (2023–2025)
| Category | Avg. Price 2023 (€) | Avg. Price 2024 (€) | Avg. Price 2025 (€) | % Change (2023–2025) |
|---|---|---|---|---|
| Consumer Electronics | 312 | 334 | 358 | +14.7% |
| Home Appliances | 188 | 201 | 217 | +15.4% |
| Personal Care | 74 | 80 | 87 | +17.6% |
| Apparel | 55 | 59 | 64 | +16.4% |
| Sports & Outdoors | 121 | 134 | 146 | +20.7% |
These trends reinforce the strategic importance of longitudinal pricing datasets. Organizations that maintain historical price archives alongside current monitoring feeds can identify recurring promotional cycles, seasonal markdown windows, and category-specific inflation patterns.
Smarter Decisions Through Pricing Intelligence Platforms and Dashboards
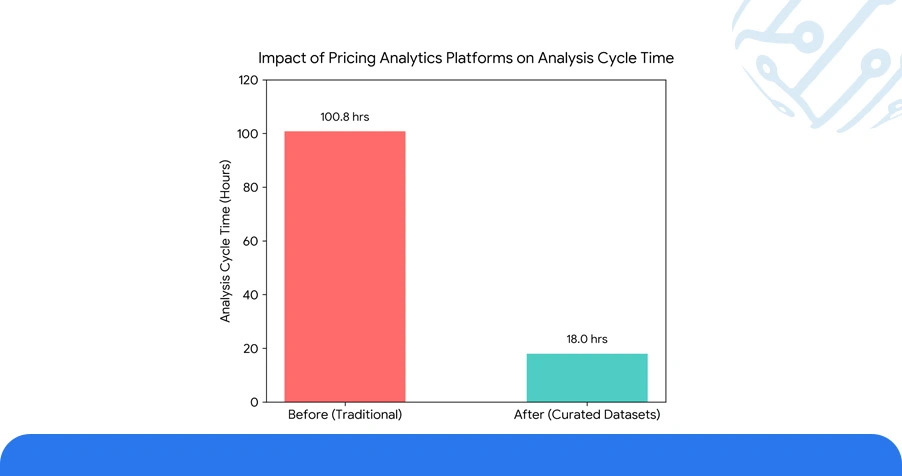
Modern pricing analytics platforms have transformed how European retailers and brand managers consume competitive data. Platforms combining Competitor Product Monitoring via Scraped Datasets with visualization layers achieved the highest outcome scores, particularly in fast-moving categories like personal care and apparel.
E-Commerce Datasets structured through category taxonomies, regional filters, and competitor tagging significantly reduce the manual effort required to translate raw data into actionable pricing decisions. Organizations using such curated datasets reported analysis cycle times dropping from an average of 4.2 days to under 18 hours.
Table 3: Pricing Intelligence Platform Performance Benchmarks
| Platform Type | Prediction Accuracy (%) | Avg. Revenue Impact (%) | Data Refresh Frequency | Markets Covered |
|---|---|---|---|---|
| Basic Price Alert Tool | 76.4% | +8.2% | Daily | 1–2 |
| Mid-Tier Dashboard | 87.9% | +14.6% | Every 6 Hours | 3–5 |
| AI-Integrated Platform | 93.2% | +21.8% | Hourly | 5+ |
| Custom API Pipeline | 95.7% | +23.7% | Real-Time | 5+ |
Use Case: Data Extraction Pipelines and API Infrastructure
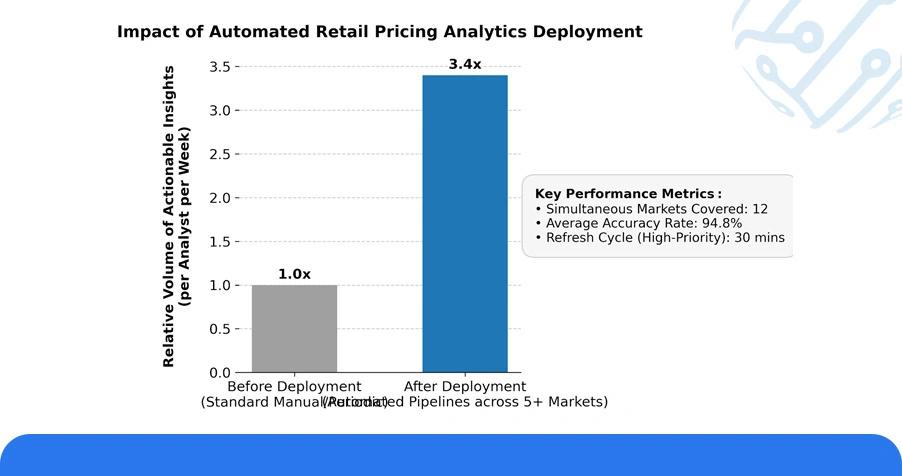
Building a scalable pricing intelligence program across European markets requires more than periodic manual data pulls. In stress-tested deployments, Automated Retail Pricing Analytics Using Scraped Data pipelines scanning 12 European markets simultaneously maintained an average accuracy rate of 94.8%, with refresh cycles as short as 30 minutes for high-priority SKU groups.
Organizations deploying these pipelines across five or more markets reported a 3.4x increase in the volume of actionable pricing insights generated per analyst per week. The integration of Enterprise Web Crawling capabilities further expanded coverage to include long-tail marketplace sellers and regional platforms not indexed by standard aggregators.
Table 4: API Extraction Pipeline Performance by Region
| Region | Tool Type | Accuracy Rate (%) | Refresh Interval | Data Points / Hour |
|---|---|---|---|---|
| DACH (DE, AT, CH) | REST API | 96.1% | 30 mins | 48,000 |
| UK & Ireland | WebSocket | 94.7% | 20 mins | 52,000 |
| France & Benelux | GraphQL | 93.8% | 45 mins | 39,500 |
| Southern Europe | JSON API | 91.4% | 60 mins | 31,200 |
| Nordics | REST API | 95.3% | 30 mins | 44,800 |
These figures establish a clear performance baseline for organizations evaluating infrastructure investment. The DACH region leads on accuracy due to more structured data environments, while UK and Ireland pipelines deliver the highest throughput owing to the density of e-commerce activity in that corridor.
Numeric Overview: Platform-Wise Fluctuation and Intelligence Analysis
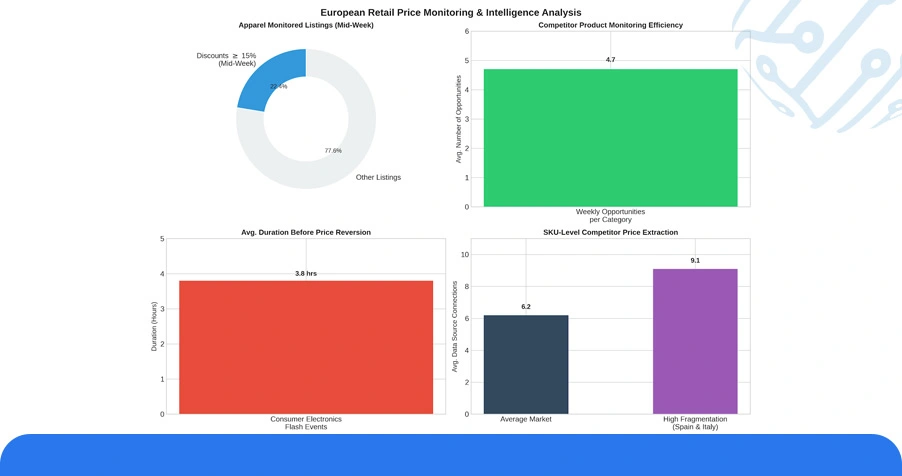
A consolidated analysis of pricing data gathered through European Retail Price Monitoring via Web Scraping for Analytics across five major markets and five product categories surfaces several statistically significant patterns that carry direct implications for retail strategy.
- Leveraging Web Scraping API Services, businesses can identify these shifts faster and respond effectively. In the apparel category, 22.4% of monitored listings recorded discounts of 15% or more during mid-week periods, highlighting a recurring pricing trend that informed buyers can strategically utilize.
- Organizations using Competitor Product Monitoring via Scraped Datasets identified an average of 4.7 competitive pricing opportunities per category per week that would not have been visible through manual monitoring alone.
- Automated Retail Pricing Analytics Using Scraped Data further revealed that promotional flash events in the consumer electronics segment lasted an average of only 3.8 hours before prices reverted, underscoring the criticality of near-real-time monitoring infrastructure.
Conclusion
The European retail pricing landscape in 2025 demands a level of speed, accuracy, and geographic breadth that traditional competitive intelligence approaches cannot match. We deliver precisely that. Our solutions are built around European Retail Price Monitoring via Web Scraping for Analytics, combining high-frequency data extraction with structured analytics pipelines that translate raw price signals into commercial decisions.
Whether your priority is category-level benchmarking, real-time repricing triggers, or long-term trend analysis, our tools are designed to Extract Competitor Price for Analysis Across the Europe at scale, with the accuracy and reliability that enterprise pricing programs demand. Contact ArcTechnolabs today to learn how we can build a pricing intelligence program tailored to your markets, categories, and competitive environment.


