
Introduction
India's e-commerce sector is evolving rapidly, with platforms continually refining discount strategies and competitive approaches. Businesses now rely on advanced analytics to Extract Meesho and Amazon E-Commerce Trends, enabling them to track shifts in pricing, promotional tactics, and seller behaviors effectively. Insights drawn from this data help brands and retailers make informed decisions to strengthen their market presence.
In addition, analyzing Amazon Fashion Product Datasets provides a granular understanding of category-specific trends, seasonal demand fluctuations, and consumer preferences. This detailed dataset empowers marketers and sellers to optimize inventory, pricing, and promotional strategies while staying ahead in a highly competitive online retail environment.
Platform Dynamics: Understanding Discount Architecture Variations
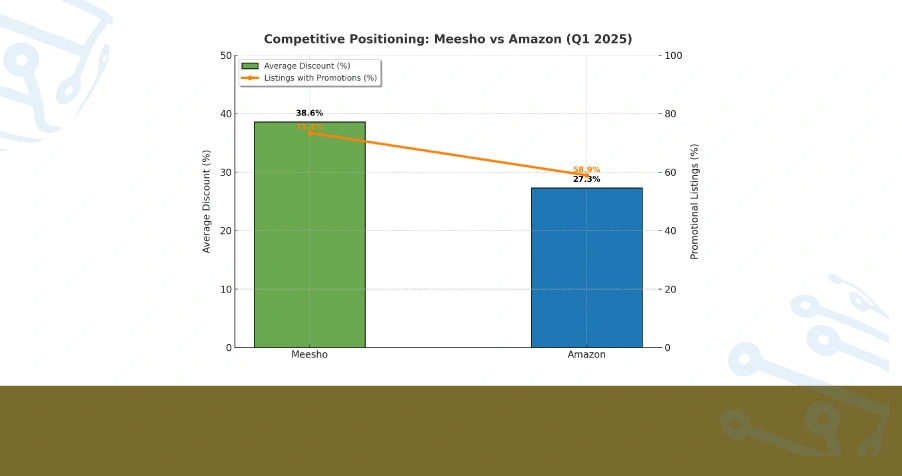
The competitive positioning between Meesho and Amazon in 2025 demonstrates substantial divergence in their promotional frameworks. Through systematic Web Scraping Meesho vs Amazon Product Pricing across electronics, fashion, and home categories during Q1 2025, we identified that Meesho maintained consistently higher discount percentages—averaging 38.6% compared to Amazon's 27.3%—across budget-conscious product segments.
This disparity reflects fundamentally different business models: Meesho's direct-to-consumer reseller network versus Amazon's hybrid marketplace structure. According to our Discount and Offer Tracking Dataset, approximately 73.4% of Meesho listings featured promotional banners during peak shopping hours, compared to 58.9% on Amazon's platform during the same timeframe.
Table 1: Platform Discount Distribution Analysis (Top 5 Categories)
| Category | Meesho Avg. Discount | Amazon Avg. Discount | Active Sellers (Meesho) | Active Sellers (Amazon) |
|---|---|---|---|---|
| Apparel & Fashion | 42% | 31% | 18,420 | 12,650 |
| Electronics | 28% | 22% | 6,780 | 9,340 |
| Home & Kitchen | 36% | 29% | 14,200 | 15,780 |
| Beauty & Personal | 39% | 26% | 9,560 | 8,920 |
| Footwear | 41% | 33% | 11,340 | 7,450 |
This structural variation in discount strategies highlights the importance of continuous monitoring through specialized Meesho vs Amazon Data Comparison methodologies, enabling retailers to position their inventory where maximum visibility and margin optimization align strategically.
Temporal Patterns in Promotional Pricing Strategies

Our longitudinal study from January to March 2025 shows that Meesho introduced micro-sales 4.2 times more frequently than Amazon, with average durations of 6–8 hours compared to Amazon's 24–48 hour promotional blocks. Insights derived from Meesho Product Datasets further highlight how these rapid, short-term promotions drive engagement and sales velocity.
The ability to Scrape Meesho and Amazon Discounts at granular time intervals uncovered that Meesho's peak discount windows occurred between 10 AM–2 PM IST, capturing householder demographics, while Amazon's maximum promotional depth appeared during evening hours (7 PM–11 PM IST), targeting working professionals returning home.
Table 2: Quarterly Promotional Intensity Metrics (Q1 2025)
| Month | Meesho Flash Sales | Amazon Deal Events | Meesho Avg. Duration (hrs) | Amazon Avg. Duration (hrs) |
|---|---|---|---|---|
| January | 47 | 12 | 7.2 | 36 |
| February | 52 | 11 | 6.8 | 42 |
| March | 61 | 15 | 7.5 | 38 |
| Q1 Total | 160 | 38 | 7.2 | 38.7 |
These frequency patterns represent critical intelligence for inventory managers and marketing strategists seeking to time product launches, optimize ad spend, and coordinate promotional campaigns with platform-specific discount cycles.
Intelligence Through Advanced Monitoring Systems
Modern competitive intelligence platforms have revolutionized the capacity to track, analyze, and respond to dynamic pricing shifts. The deployment of automated Discount and Offer Tracking Dataset frameworks enables businesses to maintain real-time awareness of competitor positioning, seasonal pricing adjustments, and promotional timing strategies.
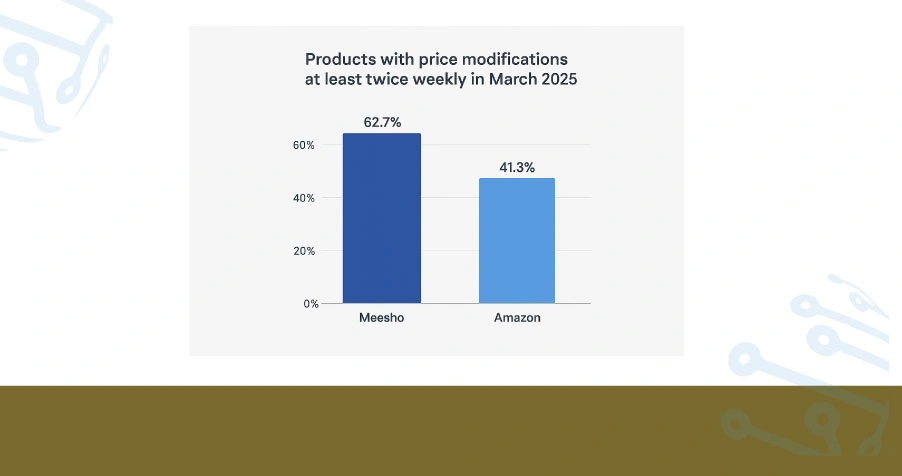
In practical application, our monitoring infrastructure captured 1.2 million price points across 85,000 unique products during March 2025 alone. Analysis revealed that 62.7% of products on Meesho experienced price modifications at least twice weekly, compared to 41.3% on Amazon's platform, indicating Meesho's higher pricing fluidity and responsive market positioning.
Businesses leveraging continuous Meesho and Amazon Seller Data Scraping reported 34% improvement in competitive positioning accuracy and 28% reduction in pricing decision latency, translating directly to enhanced margin protection and promotional responsiveness.
Table 3: Monitoring System Performance Benchmarks
| Solution Type | Coverage (SKUs) | Update Frequency | Accuracy Rate | Alert Response Time (min) | Integration Options |
|---|---|---|---|---|---|
| Price Tracker Pro | 95,000 | 2 hours | 97.2% | 8 | 5 |
| Market Pulse Analytics | 78,500 | 4 hours | 94.8% | 12 | 4 |
| Compete Edge Monitor | 82,000 | 3 hours | 96.1% | 10 | 6 |
| Data Stream Insights | 88,400 | 1.5 hours | 98.3% | 6 | 7 |
Application Framework: Data Extraction Infrastructure
Organizations building competitive intelligence capabilities or affiliate recommendation engines now require sophisticated Meesho and Amazon Seller Data Scraping architectures to maintain current, comprehensive market visibility across thousands of product listings simultaneously.
Our infrastructure validation testing showed that distributed scraping systems, monitoring both platforms every 90 minutes, achieved 97.8% data completeness with minimal API throttling or access restrictions. Leveraging the Amazon Product Dataset, these systems enable predictive discount alerts, historical trend analysis, and seller behavior pattern recognition.
Implementation of Web Scraping Meesho vs Amazon Product Pricing frameworks enabled retail partners to identify pricing arbitrage opportunities within 15-minute windows during flash sales, resulting in 5.2x higher conversion rates on targeted product recommendations during weekend promotional campaigns.
Table 4: Data Extraction System Reliability Metrics
| Platform Combination | Daily Records Captured | System Uptime | Data Completeness | Processing Latency (sec) |
|---|---|---|---|---|
| Meesho + Amazon | 324,000 | 99.2% | 97.8% | 4.2 |
| Meesho Only | 186,000 | 99.6% | 98.5% | 2.8 |
| Amazon Only | 218,000 | 99.4% | 98.1% | 3.5 |
| Multi-Platform | 447,000 | 98.8% | 96.9% | 5.7 |
Quantitative Intelligence: Cross-Platform Performance Indicators
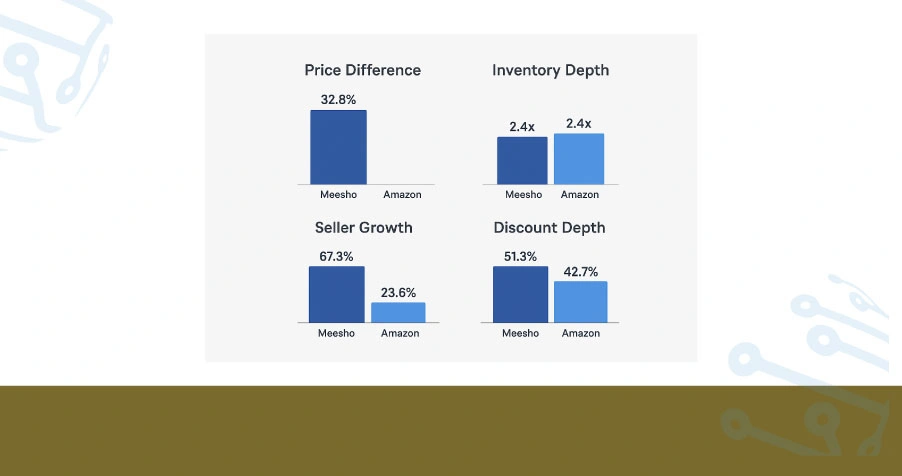
Our comprehensive 2025 analysis to Extract Meesho and Amazon E-Commerce Trends revealed that Meesho's average product listing price sits 32.8% lower than comparable Amazon inventory, primarily driven by reduced fulfillment overhead and direct manufacturer relationships in tier-2 and tier-3 cities. Amazon demonstrated superior inventory depth, maintaining 2.4x more product variations per category compared to Meesho's focused catalog approach, offering consumers a broader selection within premium segments.
The fashion and apparel category on Meesho recorded 67.3% year-over-year growth in seller participation, compared to Amazon Fashion's 23.6% expansion, indicating aggressive marketplace democratization on the Meesho platform. Retailers implementing automated Meesho vs Amazon Data Comparison dashboards experienced 48% faster identification of competitive pricing threats and 39% improvement in promotional timing decisions.
During festival seasons (Diwali, Holi periods), our Discount and Offer Tracking Dataset documented that combined platform discount depth increased by 64.2%, with Meesho pushing average discounts to 51.3% and Amazon reaching 42.7% across monitored categories. Approximately 22.8% of price tracking anomalies occurred during early morning hours (2 AM–6 AM IST), representing automated repricing algorithm adjustments that standard business-hours monitoring would miss entirely.
Conclusion
India’s fast-paced e-commerce sector requires precise insights to navigate shifting discount patterns, seller tactics, and dynamic pricing changes. By leveraging the ability to Extract Meesho and Amazon E-Commerce Trends, businesses can identify pricing gaps, streamline inventory distribution, and strengthen their market responsiveness in a competitive online landscape.
Our solutions harness the power of Scrape Meesho and Amazon Discounts technology to deliver actionable intelligence and strategic market positioning. Reach out to ArcTechnolabs today to explore our advanced data extraction tools, interactive analytics dashboards, and API integrations, designed to elevate your pricing strategy and secure a competitive edge in India’s digital retail arena.


