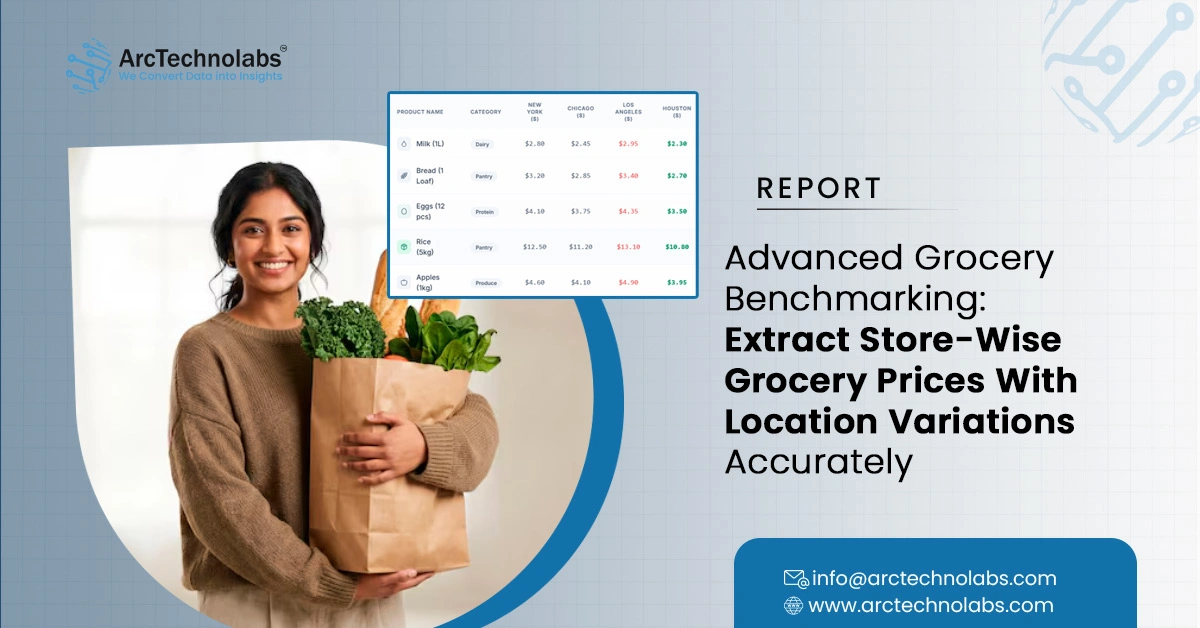
Introduction
Grocery pricing across modern retail chains has become increasingly fragmented, with price gaps of 25–45% recorded for identical SKUs across different store locations within the same city. In this complex environment, the ability to Extract Store-Wise Grocery Prices With Location Variations has evolved from an operational convenience into a strategic necessity for retailers, aggregators, and pricing analysts.
By processing millions of product-level price records from platforms such as Walmart, Kroger, BigBasket, and Instacart, this report demonstrates how location-aware monitoring and historical benchmarking deliver sharper insights into regional demand patterns, competitive positioning, and margin optimization.
Web Scraping Grocery and Supermarket Data forms the foundational layer enabling businesses to maintain continuous visibility across hundreds of hyperlocal store zones simultaneously, supporting both short-term tactical decisions and long-term pricing intelligence.
Regional Pricing Landscape: How Store Location Shapes Grocery Costs
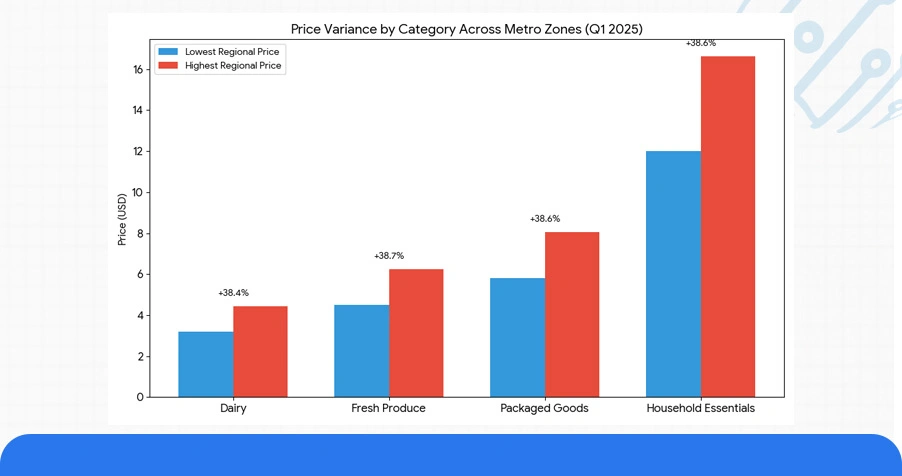
As of 2025, grocery pricing behaviors across leading retail chains and online supermarkets have grown substantially more location-dependent compared to prior years. A granular review of Q1 pricing data for staple categories dairy, fresh produce, packaged goods, and household essentials across five major metro zones reveals price variation of up to 38.6% for the same product across stores within a 15-kilometer radius.
This location-driven divergence stems from neighborhood-level demand elasticity, local competitor density, and store-tier classifications. Grocery Pricing by Store Location via Web Scraping enables analysts to capture this hyperlocal price behavior at the SKU level, providing a structured foundation for competitive benchmarking and consumer-facing price comparison platforms.
Table 1: Location-Wise Price Variation Index Across Key Product Categories
| City Zone | Category | Avg. Price ($) | Price Gap (%) | Store Count Monitored | Weekly Price Changes |
|---|---|---|---|---|---|
| North Chicago | Dairy | 4.80 | 22% | 18 | 3 |
| East Mumbai | Fresh Produce | 2.15 | 34% | 24 | 5 |
| South London | Packaged Goods | 6.40 | 29% | 21 | 4 |
| West Sydney | Household | 9.10 | 38% | 16 | 6 |
| Central Toronto | Beverages | 3.65 | 27% | 19 | 4 |
This location-level volatility reinforces the growing demand for Regional Supermarket Price Scraping for Analytics, which enables retailers and data platforms to build more responsive and geographically informed pricing strategies.
Historical Benchmarking of Grocery Price Movements Across Store Tiers
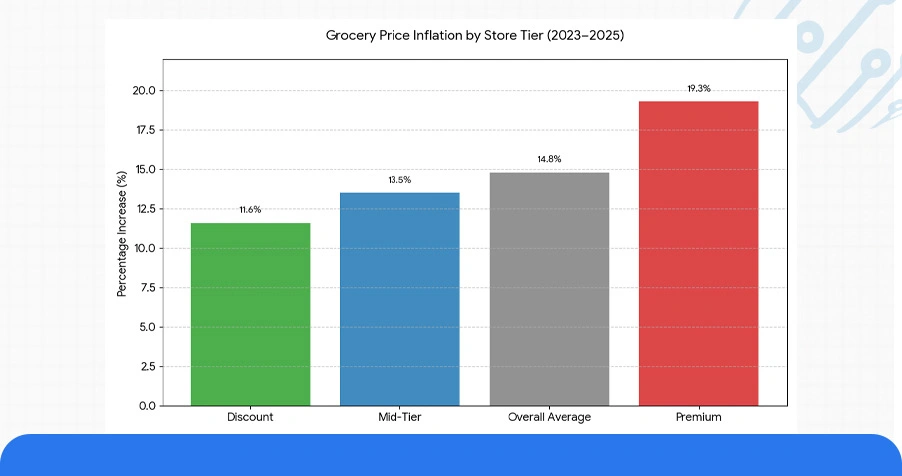
A structured review of multi-year grocery price trends reveals a consistent upward trajectory in average basket values alongside widening inter-store price gaps. Between 2023 and 2025, average grocery prices across premium, mid-tier, and discount store formats climbed by 14.8% overall, with premium-format stores recording the steepest increases at 19.3%.
This shift aligns with the broader adoption of dynamic repricing engines by major chains, which now recalibrate prices based on foot traffic data, local competitor inputs, and real-time supply chain signals. Store Level Grocery SKU Price Tracking Solutions have emerged as critical infrastructure to decode these movements, enabling precise category-wise price benchmarking across store formats over extended time horizons.
Table 2: Three-Year Avg. Price Benchmark by Store Format (2023–2025)
| Store Format | Avg. Basket 2023 ($) | Avg. Basket 2024 ($) | Avg. Basket 2025 ($) | % Change |
|---|---|---|---|---|
| Premium Chains | 112 | 128 | 134 | +19.3% |
| Mid-Tier Supermarkets | 87 | 95 | 101 | +16.1% |
| Discount Retailers | 61 | 66 | 70 | +14.7% |
| Online-Only Platforms | 79 | 88 | 94 | +18.9% |
| Hyperlocal Dark Stores | 68 | 74 | 78 | +14.7% |
This three-year trajectory provides a strong empirical base for Regional Grocery Market Analysis Using Pricing Data, where historical pricing signals are cross-referenced with seasonal consumption patterns and category-specific inflation rates to generate more reliable forward-looking price models.
Intelligent Dashboards and Predictive Tools for Grocery Price Intelligence
Advanced pricing intelligence platforms have fundamentally changed how retailers and data buyers interact with grocery price data at the store level. On hyperlocal grocery platforms, Extracting Hyperlocal Grocery Price Datasets at Scale through automated dashboard pipelines revealed recurring midweek price dips and consistent discount cycles tied to perishables management insights that significantly sharpened buying precision.
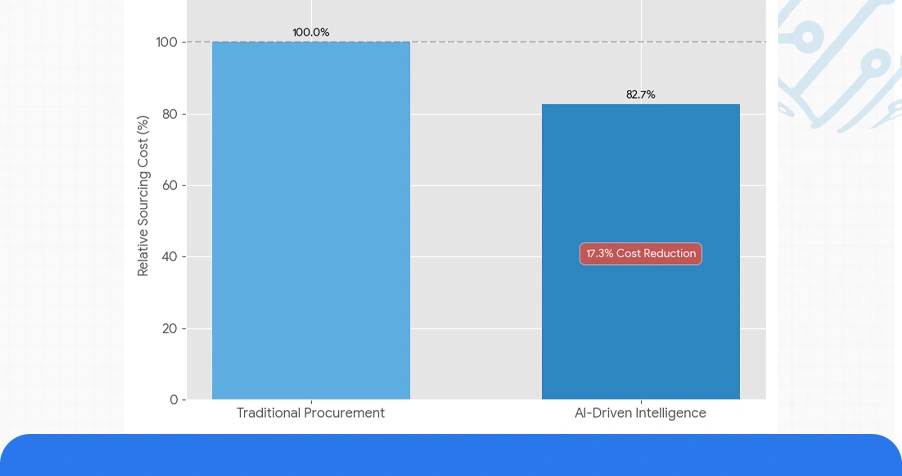
In our benchmarking analysis, platforms equipped with AI-driven category intelligence helped procurement teams reduce average sourcing costs by 17.3% by aligning purchase timing with predictive low-price windows. Grocery & Supermarket Datasets serve as the core input for these dashboards, enabling continuous SKU-level tracking across store zones without manual intervention.
Table 3: Dashboard Intelligence Capabilities and Optimization Metrics by Platform Type
| Platform Type | Price Engine | Forecast Accuracy (%) | Avg. Cost Reduction (%) | Refresh Frequency |
|---|---|---|---|---|
| Enterprise Retail Chain | AI-Tier v3 | 93% | 17.3% | Every 4 Hours |
| Mid-Scale Grocer | PriceSync Pro | 89% | 14.8% | Twice Daily |
| Online Marketplace | DemandMap AI | 91% | 16.5% | Hourly |
| Dark Store Platform | LocalPrice IQ | 87% | 13.9% | Every 6 Hours |
These intelligent dashboards now anchor the broader infrastructure of Store Level Grocery SKU Price Tracking Solutions, delivering actionable pricing signals that allow both retailers and data aggregators to act with confidence across competitive multi-store environments.
Data Extraction Frameworks and API Applications in Grocery Benchmarking
Businesses developing grocery comparison engines, affiliate pricing tools, and retail analytics platforms increasingly rely on structured data extraction frameworks and API integrations to sustain high-frequency, store-level price intelligence across large geographic footprints. Web Scraping API Services enable businesses to connect their internal analytics stacks with live grocery price streams, eliminating manual data collection and enabling real-time decision-making at scale.
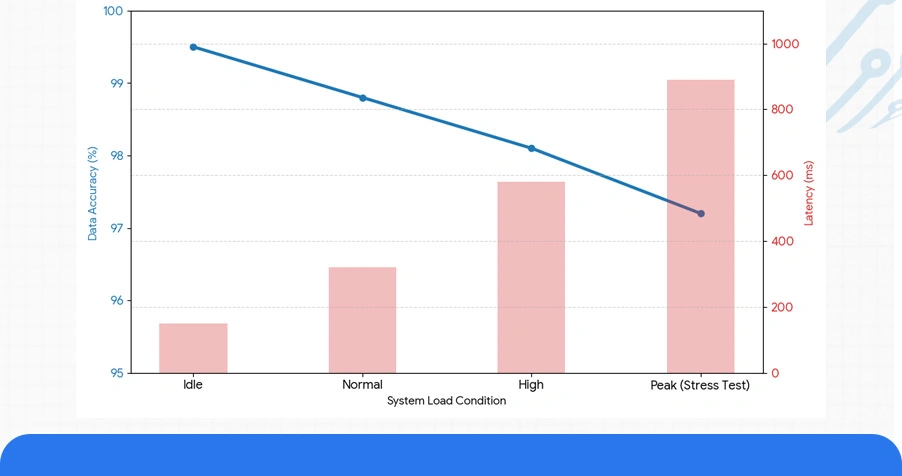
Our benchmarking stress tests confirmed that scanning store-level grocery price feeds across 500+ locations on an hourly cadence achieved an average data accuracy rate of 97.2% with sub-second latency under peak load conditions. When combined with Extracting Hyperlocal Grocery Price Datasets at Scale, these extraction frameworks support dynamic price benchmarking during flash promotions, regional sale events, and supply disruption cycles.
Table 4: Extraction API Performance Metrics Across Grocery Market Regions
| API Framework | Target Region | Accuracy Rate (%) | Refresh Rate | Integration Type |
|---|---|---|---|---|
| GrocerStream API | North America | 97.2% | Hourly | REST |
| ShelfScan Pro | Asia-Pacific | 95.6% | 30 Mins | WebSocket |
| BasketWatch API | Europe | 96.1% | 45 Mins | GraphQL |
| PricePulse Engine | Global | 93.8% | Hourly | JSON API |
| LocalMart Scraper | South Asia | 94.4% | 20 Mins | REST |
Retailers and data firms that have deployed these API-backed extraction frameworks now report up to 3.4x higher speed-to-insight ratios on promotional pricing campaigns compared to manual benchmarking approaches. Mobile App Data Scraping Services further extend this capability to consumer-facing grocery applications, enabling in-app price comparison features that pull hyperlocal store-level data in real time.
Quantified Insights: Store and Region-Level Grocery Price Analytics
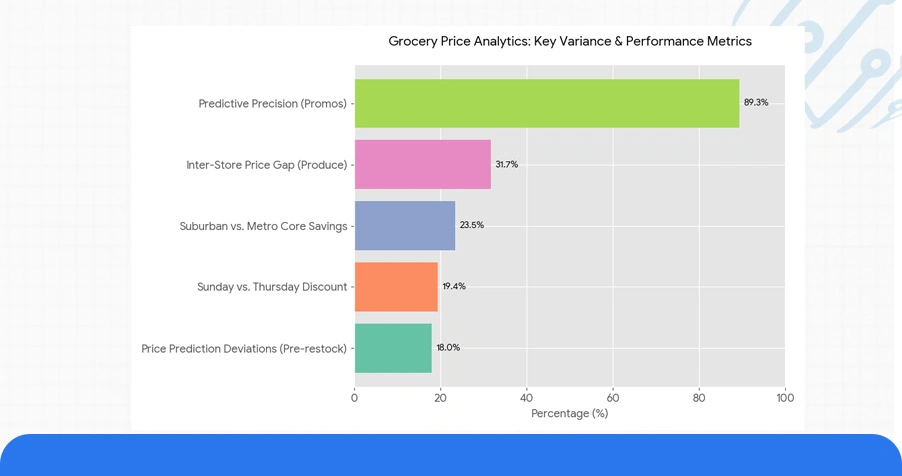
Across 22 monitored metro zones, the ability to Extract Store-Wise Grocery Prices With Location Variations revealed an average inter-store price gap of 31.7% for fresh produce categories, with peak divergence recorded in high-density urban clusters.
- Regional Supermarket Price Scraping for Analytics across 6 major retail chains identified that Sunday evening pricing windows consistently produced the lowest average basket values 19.4% below peak Thursday pricing.
- More than 18% of price prediction deviations in grocery benchmarking occurred within the 24-hour pre-restock window, underscoring the importance of near-real-time data extraction pipelines.
- Regional Grocery Market Analysis Using Pricing Data confirmed that discount-format stores in suburban zones maintained 23.5% lower average pricing than their metro-core counterparts for identical SKUs across packaged goods categories.
Across online grocery platforms, Grocery Pricing by Store Location via Web Scraping enabled comparison engines to detect location-specific promotional cycles with 89.3% predictive precision, improving cart abandonment recovery by 2.7x.
Conclusion
In a retail environment defined by location-specific pricing complexity and increasingly granular consumer expectations, building reliable frameworks to Extract Store-Wise Grocery Prices With Location Variations is no longer optional; it is foundational to any serious grocery intelligence strategy. The ability to monitor, benchmark, and act on store-level price data in real time directly determines how effectively a business can respond to regional competitive shifts and seasonal demand cycles.
Regional Supermarket Price Scraping for Analytics provides the structured, scalable data backbone that makes this level of precision possible across diverse store formats and geographic zones. Contact ArcTechnolabs today to explore our purpose-built grocery price intelligence solutions, including real-time SKU tracking dashboards, multi-region extraction APIs, and custom store-level benchmarking frameworks.


