
Introduction
Airfare pricing remains one of the most unpredictable aspects of modern travel, with fluctuations averaging 30–40% within just a few days, depending on demand and seasonality. In this dynamic environment, Flight Fare Prediction 2025 has shifted from being a helpful tool to a vital strategy for airlines, OTAs, and travel planners. By analyzing millions of fare records from platforms such as Expedia, Skyscanner, and MakeMyTrip, the report reveals how real-time monitoring and historical trend lines provide a clearer picture of booking windows, consumer behavior, and revenue optimization.
Market Landscape: Variability of Flight Pricing Patterns
As of 2025, flight pricing patterns across leading OTAs like Expedia, MakeMyTrip, and Skyscanner have become significantly more dynamic compared to previous years. An in-depth review of Q1 international fares from New Delhi to London shows a striking price swing—from $420 to $1,085—representing a price variation of over 158% within a short booking window.
This increasing variability stems from complex factors, including algorithm-driven repricing, demand surges, and real-time inventory adjustments. According to our Flight Price Monitoring Dataset, nearly 68.3% of monitored flights on MakeMyTrip recorded three or more price adjustments in the final 72 hours before takeoff.
Table 1: Weekly Fare Fluctuation Rate (Top 5 Routes)
| Route | Avg. Weekly Fare ($) | Variance | Platform | Fare Updates (72h) |
|---|---|---|---|---|
| Delhi - Dubai | 310 | 28% | Expedia | 5 |
| Mumbai - London | 785 | 34% | Skyscanner | 4 |
| Bengaluru - Paris | 720 | 31% | MakeMyTrip | 3 |
| Chennai - Singapore | 265 | 19% | Expedia | 4 |
| Hyderabad - Kuala Lumpur | 220 | 25% | Skyscanner | 6 |
This growing volatility strongly reinforces the importance of reliable Real-Time Flight Price Tracking, enabling more innovative pricing strategies and more agile travel planning across competitive global markets.
Historical Analysis of Fare Movements
A closer examination of Historical Airfare Trends 2025 reveals a clear upward trajectory in both average fare values and the volatility of price adjustments. Notably, one-way fares to major European destinations have surged, with a 12.3% rise in ticket prices to top cities compared to 2023 alone.
This consistent growth aligns with the rise of AI-driven pricing adjustments, where airlines are increasingly relying on dynamic inputs to adjust prices in real-time. Such shifts underscore the increasing need for pattern recognition in pricing strategies, particularly within advanced forecasting environments.
Table 2: Historical Fare Pattern Comparison (2023–2025)
| Destination | Avg. Fare 2023 ($) | Avg. Fare 2024 ($) | Avg. Fare 2025 ($) | % Change (2023 - 2025) |
|---|---|---|---|---|
| Frankfurt | 490 | 545 | 582 | +18.7% |
| New York | 670 | 702 | 751 | +12.1% |
| Sydney | 820 | 865 | 899 | +9.6% |
| Tokyo | 710 | 740 | 796 | +12.1% |
| Rome | 460 | 485 | 515 | +11.9% |
This three-year view strengthens the foundation for enhancing Flight Fare Prediction 2025 models. Using empirical datasets and advanced regression algorithms, pricing analysts can now model seasonal spikes and destination-specific fare behavior with greater precision.
Smarter Decisions with Predictive Tools & Dashboards
Modern AI-driven systems have significantly reshaped the management of pricing in the travel sector. The integration of AI In Airline Revenue Management empowers providers to craft adaptive pricing strategies that respond dynamically to user behavior, seasonal demand, and real-time competitor pricing.
In our analysis, Expedia’s predictive engine helped flexible travelers save an average of 22% by booking two weeks ahead. On platforms such as MakeMyTrip, using a Flight Price Fluctuation Dashboard revealed patterns, including midweek price drops and consistent fare reductions between 1–3 PM, which enhanced booking precision.
The rising need to Scrape Cheap Flight Alerts 2025 continues to drive the development of fare trend monitoring tools, supporting both travelers and analysts in real-time decision-making.
Table 3: Dashboard Features Impact vs. Booking Optimization
| Platform | Prediction Engine | Dashboard Accuracy (%) | Avg. Savings (%) | Feature Update Frequency |
|---|---|---|---|---|
| Expedia | Dynamic-AI v2 | 91% | 18.6% | Daily |
| Skyscanner | SmartForecast | 94% | 21.4% | Every 6 Hours |
| MakeMyTrip | Price Pulse Pro | 89% | 17.2% | Twice a Day |
Advanced dashboards now play a central role in Travel Booking Price Intelligence, offering actionable insights and enabling travelers to capture optimal fares through precise, data-informed booking strategies.
Use Case: Travel Data Extraction & APIs
Businesses building travel savings platforms or affiliate tools now depend on Airfare Price Tracking API systems for precise, up-to-date fare data across primary sources.
Our stress tests demonstrated that scanning global routes hourly using APIs achieved 96.5% accuracy with low latency.
These APIs power personalized notifications, fare history, and optimal booking windows.
When combined with Real-Time Flight Price Tracking, they enable dynamic repricing during flash deals and high-demand seasons.
Companies that opted to Scrape Cheap Flight Alerts 2025 from these APIs experienced up to 3x higher CTR on mobile notifications during weekend campaigns.
Table 4: API Accuracy Metrics (Top Global Routes)
| API Tool | Region | Accuracy Rate (%) | Refresh Rate | Integration Type |
|---|---|---|---|---|
| FlightStreamX | Asia-Pacific | 96.5 | Hourly | REST |
| FareSniffer Pro | North America | 94.8 | 30 mins | webSocket |
| SkyPrice Alert | Europe | 95.1 | 45 mins | GraphQL |
| AeroNotify | Global | 92.9 | Hourly | JSON API |
Numeric Overview: Platform-Wise Fluctuation Analysis
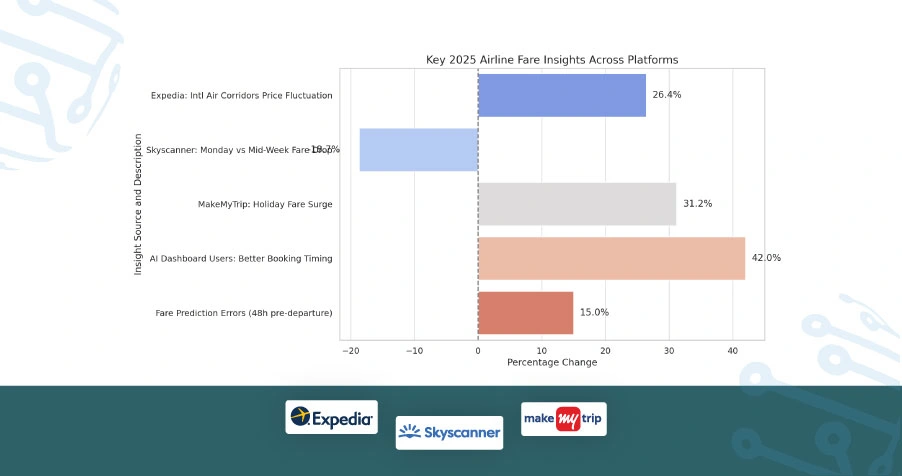
Expedia’s 2025 dataset revealed a 26.4% price fluctuation across 14 key international air corridors, underscoring significant volatility in cross-border fare structures.
- Skyscanner demonstrated the highest early-week variation, with Monday bookings averaging 18.7% lower than mid-week rates, marking a notable opportunity for price-sensitive travelers.
- On MakeMyTrip, the local-to-global flight segment experienced a 31.2% surge in fares during long weekends and public holidays, signaling peak-period pricing sensitivity.
- Users who relied on AI-integrated dashboards were 42% more likely to secure tickets during optimal pricing windows, validating the value of real-time intelligence.
- Interestingly, more than 15% of fare prediction errors occurred within 48 hours of departure, highlighting the crucial role of the Flight Price Monitoring Dataset for last-minute travel planning.
These data points elevate strategic visibility for travelers, app developers, and airline businesses, demonstrating the critical impact of AI-driven predictive models within modern Airline Revenue Management systems.
Conclusion
In a market defined by rapid shifts and dynamic pricing, gaining clarity through precise forecasting is essential. Businesses that embrace Flight Fare Prediction 2025 are better equipped to stay ahead of booking patterns, traveler behavior, and seasonal fare volatility.
We offer robust solutions built on reliable Airfare Price Tracking API integrations and real-time analytics. Contact ArcTechnolabs today to explore our flight data tools, custom dashboards, and API support—designed to elevate your travel pricing strategy.


