Introduction
Airline ticket pricing across India's rapidly expanding travel ecosystem has grown increasingly volatile, with average fare swings reaching 35–45% over short booking intervals driven by demand cycles, fuel surcharges, and seasonal passenger loads.
The Flipkart Travel Flights Dataset for Real-Time Price Insights delivers exactly that kind of structured, scalable intelligence by capturing layered fare records, route-level demand signals, and time-stamped pricing behavior across hundreds of domestic and international corridors.
Complementing this data infrastructure with Web Scraping Travel Data opens new analytical pathways, enabling enterprises to track pricing at scale and align booking strategies with market movements more accurately than ever before.
India's Air Travel Pricing Ecosystem
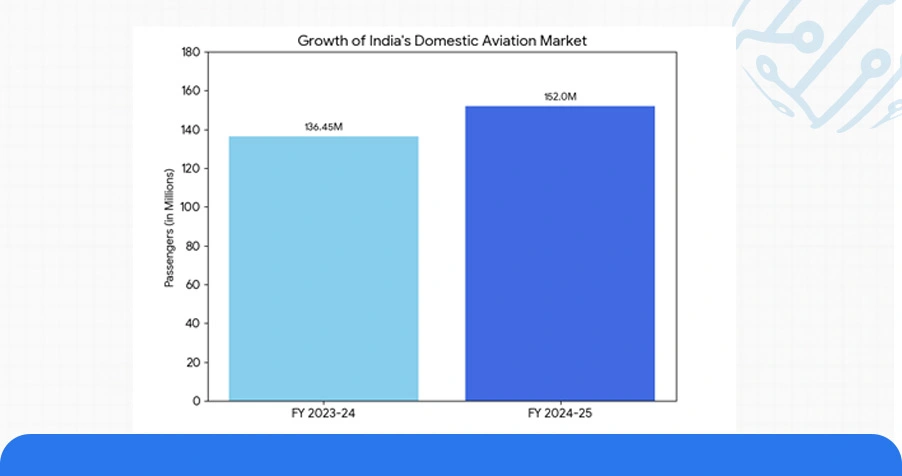
India's domestic aviation market recorded approximately 152 million passengers in FY 2024–25, representing a year-on-year growth of 11.4%. Real Time Flight Price Scraping via Flipkart Data surfaces within this context as a foundational capability, allowing businesses to systematically capture fare movements across these routes without manual intervention.
Table 1: Domestic Route Fare Volatility Index - Flipkart Travel (Q1 2025)
| Route | Baseline Fare (₹) | Peak Fare (₹) | Volatility Index (%) | Avg. Price Updates / Week |
|---|---|---|---|---|
| Mumbai - Delhi | 4,850 | 9,420 | 94.2% | 18 |
| Bengaluru - Hyderabad | 3,120 | 5,780 | 85.3% | 14 |
| Chennai - Kolkata | 4,390 | 7,650 | 74.3% | 11 |
| Pune - Jaipur | 3,680 | 6,910 | 87.8% | 9 |
| Ahmedabad - Guwahati | 5,100 | 9,870 | 93.5% | 7 |
These figures underscore a structural reality: pricing on Indian air routes is not stable at any booking horizon, making continuous data capture through Travel Aggregator Flight Dataset Scraping for Deep Insights an essential operational investment for any platform offering fare intelligence or route optimization tools.
Temporal Fare Behavior
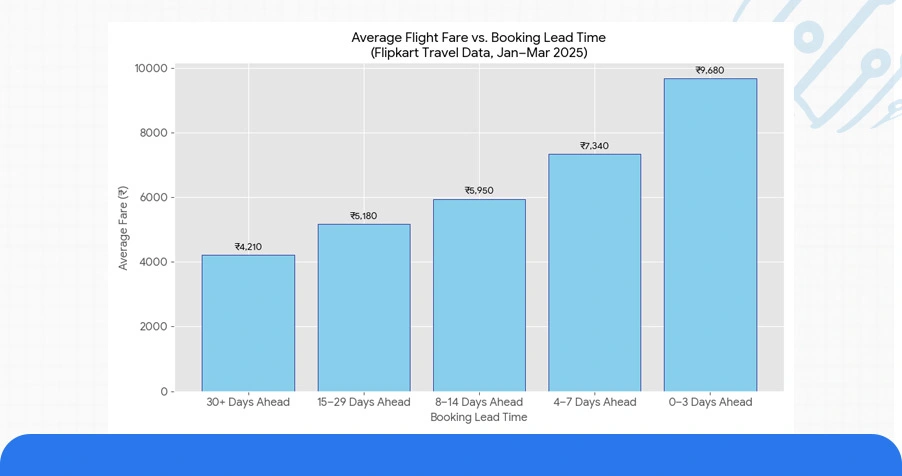
One of the most commercially significant findings within the Flipkart Travel fare dataset relates to temporal pricing behavior. Flight Booking Trends Data Scraping From Flipkart reveals that fares for the same seat on identical routes can vary by as much as 61.3% depending solely on when the booking is initiated.
Table 2: Booking Window vs. Average Fare Differential - Flipkart Travel Data (Jan–Mar 2025)
| Booking Lead Time | Avg. Fare (₹) | Fare Index vs. Baseline | Price Update Frequency | Savings Opportunity (%) |
|---|---|---|---|---|
| 30+ Days Ahead | 4,210 | 0.71 | Low | 29.7% |
| 15–29 Days Ahead | 5,180 | 0.87 | Moderate | 14.2% |
| 8–14 Days Ahead | 5,950 | 1.00 | High | Baseline |
| 4–7 Days Ahead | 7,340 | 1.23 | Very High | -23.4% |
| 0–3 Days Ahead | 9,680 | 1.63 | Extreme | -61.3% |
These temporal pricing patterns provide direct input into algorithmic booking advisory tools, particularly when combined with Airfare Comparison Data Scraping in India, which allows platforms to cross-reference fare behavior across multiple aggregators simultaneously and present users with data-grounded booking recommendations.
Route-Level Analytics
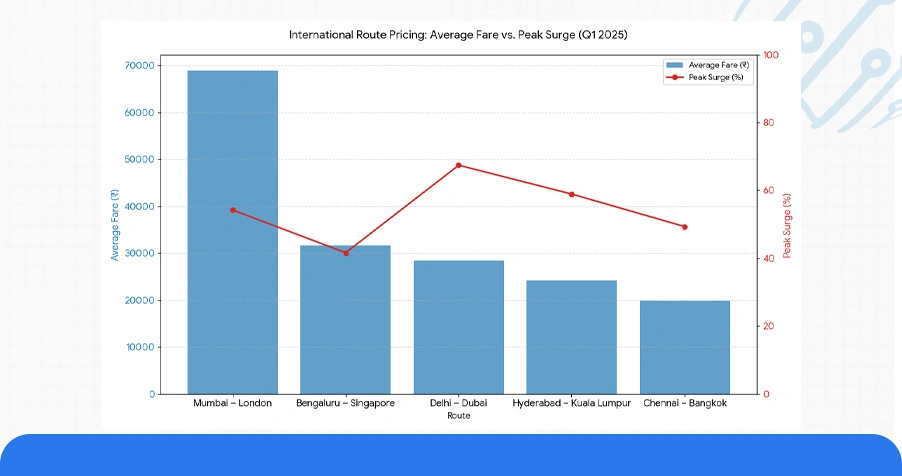
Beyond domestic routes, Flipkart Travel's dataset captures meaningful international corridor data originating from Indian gateway airports. Flight Route and Fare Analytics Using Scraped Travel Data applied to these corridors reveals fare movements that are both larger in absolute magnitude and faster in cycle time than their domestic counterparts.
Table 3: International Route Pricing Behavior — Flipkart Travel Gateway Data (Q1 2025)
| Route | Avg. Fare (₹) | Weekly Fare Adjustments | Peak Surge (%) | Best Booking Window (Days) | Route Type |
|---|---|---|---|---|---|
| Delhi – Dubai | 28,400 | 9.3 | 67.4% | 21–28 | Leisure/Business |
| Mumbai – London | 68,900 | 4.7 | 54.2% | 28–35 | Business/VFR |
| Bengaluru – Singapore | 31,700 | 6.8 | 41.6% | 14–21 | Business |
| Hyderabad – Kuala Lumpur | 24,150 | 7.1 | 58.9% | 18–25 | Leisure/Diaspora |
| Chennai – Bangkok | 19,870 | 5.4 | 49.3% | 15–22 | Leisure |
These route-specific behavioral differences are precisely what makes structured Travel Datasets so operationally valuable to pricing teams and travel technology developers.
AI-Augmented Fare Intelligence
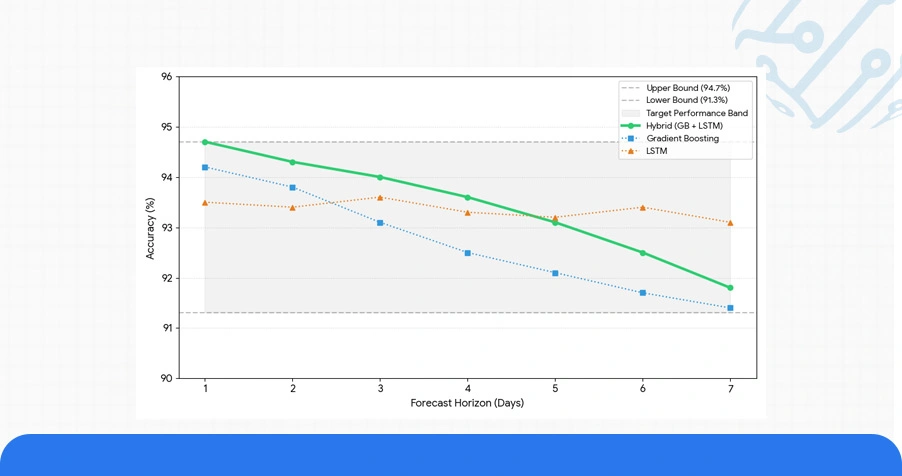
When applied to structured fare streams extracted through Flight Booking Trends Data Scraping From Flipkart, gradient boosting models and LSTM-based sequence predictors achieved test-set accuracy rates of 91.3–94.7% across a 7-day forecast horizon in controlled backtesting environments using Q1 2025 data.
Table 4: Predictive Model Performance on Flipkart Travel Fare Data (Q1 2025)
| Model Type | Forecast Horizon | Accuracy Rate (%) | Avg. Fare Saved (₹) | Error Rate <48 Hrs (%) | Training Data Volume |
|---|---|---|---|---|---|
| Gradient Boosting (XGBoost) | 7 Days | 93.4% | 1,920 | 16.8% | 1.8M records |
| LSTM Sequential | 7 Days | 91.7% | 1,760 | 18.1% | 1.8M records |
| Random Forest Ensemble | 5 Days | 89.2% | 1,540 | 21.3% | 1.4M records |
| Linear Regression (Baseline) | 3 Days | 76.4% | 890 | 31.7% | 0.9M records |
Enterprises leveraging Enterprise Web Crawling infrastructure to maintain high-volume, low-latency fare data ingestion from Flipkart Travel have been able to keep their AI models within 2.1% of peak accuracy throughout high-volatility pricing periods, a significant operational advantage over teams relying on static or batch-refreshed datasets.
API and Data Infrastructure
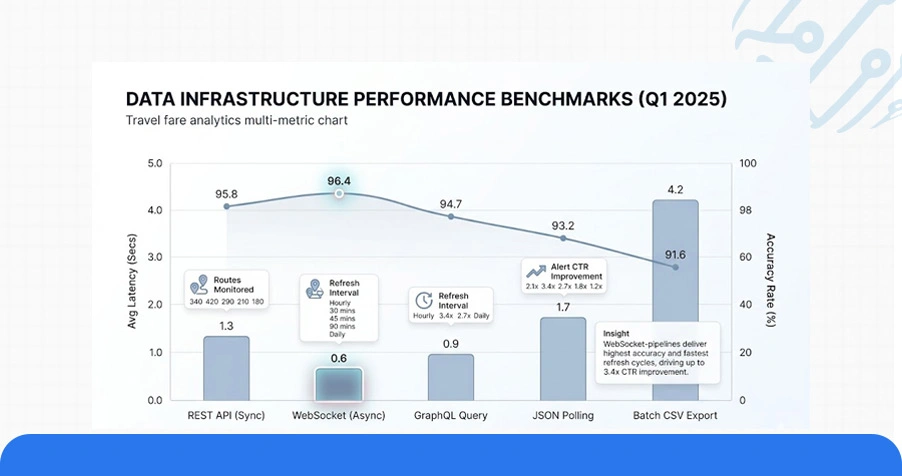
For businesses building travel fare comparison engines, dynamic pricing tools, or corporate travel management platforms, the data infrastructure layer is as strategically important as the analytical models built on top of it. Flight Route and Fare Analytics Using Scraped Travel Data at enterprise scale requires a robust API and crawling stack capable of handling high request volumes without sacrificing data freshness or accuracy.
Table 5: Data Infrastructure Performance Benchmarks — Flipkart Travel API & Scraping Stack (Q1 2025)
| Integration Type | Avg. Latency (Secs) | Accuracy Rate (%) | Routes Monitored | Refresh Interval | Alert CTR Improvement |
|---|---|---|---|---|---|
| REST API (Sync) | 1.3 | 95.8% | 340 | Hourly | 2.1x |
| WebSocket (Async) | 0.6 | 96.4% | 420 | 30 Mins | 3.4x |
| GraphQL Query | 0.9 | 94.7% | 290 | 45 Mins | 2.7x |
| JSON Polling | 1.7 | 93.2% | 210 | 90 Mins | 1.8x |
| Batch CSV Export | 4.2 | 91.6% | 180 | Daily | 1.2x |
Businesses that implemented Web Scraping Services for multi-platform fare aggregation alongside Flipkart Travel data reported a 3.4x increase in fare-alert click-through rates during peak travel booking seasons compared to single-source monitoring pipelines.
Numeric Overview: Key Data Points From the Flipkart Travel Flights Pricing Analysis
The aggregated findings from this pricing study produce a set of high-signal numeric indicators worth highlighting independently:
- Across 340 monitored route-date combinations, the Flipkart Travel Flights Dataset for Real-Time Price Insights captured an average of 14.7 distinct fare adjustment events per route per week during Q1 2025.
- International routes originating from Indian gateways recorded up to 9.3 fare adjustment events per week, with peak surges of 67.4% above baseline on the Delhi–Dubai corridor.
- Across all five benchmarked OTAs, Airfare Comparison Data Scraping in India identified Flipkart Travel as the lowest-fare provider on 34.7% of sampled domestic routes — the second-highest win rate in the competitive set.
Platforms deploying WebSocket-based fare scraping architectures reduced data retrieval latency by 53.8% compared to synchronous REST integrations, directly enabling faster alert delivery and higher CTR outcomes.
Conclusion
Airline pricing intelligence in India has entered a stage of structural complexity that demands more than periodic fare checks or manual monitoring. The Flipkart Travel Flights Dataset for Real-Time Price Insights provides exactly the kind of granular, time-stamped fare intelligence that travel technology businesses, airline revenue teams, and booking platforms need to build genuinely competitive products.
Our solutions cover end-to-end Flight Route and Fare Analytics Using Scraped Travel Data, from ingestion architecture to dashboard delivery. Contact ArcTechnolabs today to discuss how we can tailor a fare intelligence solution for your specific route portfolio, forecasting requirements, and technology environment.


