Introduction
The fast-moving consumer goods sector operates within one of the most price-sensitive retail environments globally, where product prices can shift 15–25% across regions within a single week due to supply chain fluctuations, competitor actions, and localized demand patterns. In 2025, FMCG Price Monitoring Across Regions Using Scraped Data has become a foundational practice for retailers, distributors, and category managers seeking to maintain competitive positioning.
By aggregating scraped pricing data from major retail platforms such as BigBasket, Amazon Fresh, Walmart, Tesco, and Carrefour, this report uncovers how structured data pipelines and real-time price tracking are transforming category-level decisions, promotional planning, and shelf price benchmarking across diverse geographies. For businesses building pricing intelligence capabilities, Web Scraping Quick Commerce Data serves as a critical starting point for capturing hyper-local price signals that traditional market research tools consistently miss.
Market Landscape: Regional Pricing Variability Across FMCG Categories
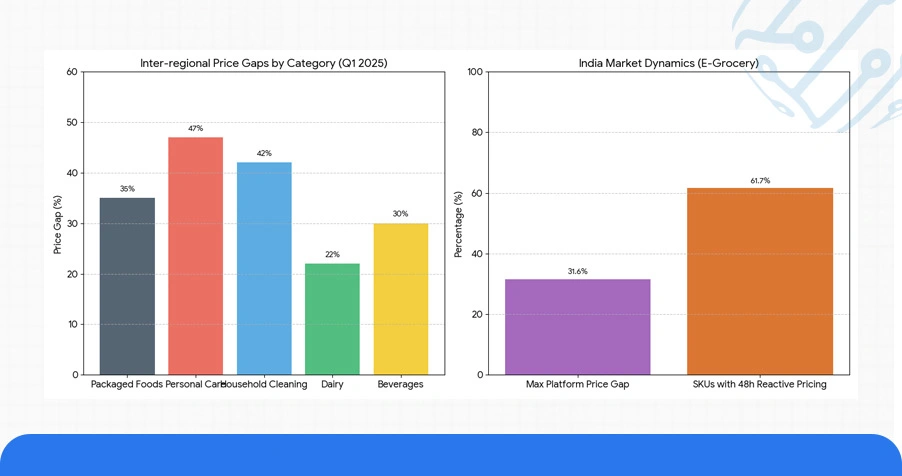
Across North America, Europe, South Asia, and Southeast Asia, FMCG pricing patterns have grown increasingly fragmented. A structured review of Q1 2025 data across five major product categories packaged foods, personal care, household cleaning, dairy, and beverages reveals average inter-regional price gaps of 22–47%, even for identical SKUs sold under the same brand.
In India alone, price variation for a 1-litre cooking oil brand across BigBasket, Blinkit, and JioMart reached 31.6% within a 30-day observation window. Regional Grocery Price Analysis Using Web Scraping across these platforms identified that nearly 61.7% of monitored SKUs experienced at least two price revisions within 48 hours of a competitor promotion going live, confirming the reactive nature of FMCG pricing systems.
Table 1: Regional Price Variance Across Key FMCG Categories (Q1 2025)
| Category | Avg. Price Range ($) | Inter-Regional Variance (%) | Platforms Monitored | Price Updates (48h) |
|---|---|---|---|---|
| Packaged Foods | 1.80 – 5.40 | 38% | Amazon Fresh, BigBasket | 4 |
| Personal Care | 3.20 – 8.75 | 42% | Walmart, Tesco | 5 |
| Household Cleaning | 2.10 – 5.90 | 34% | Carrefour, Flipkart | 3 |
| Dairy Products | 0.90 – 2.60 | 47% | JioMart, Sainsbury's | 6 |
| Beverages | 1.40 – 3.80 | 29% | Amazon Fresh, Walmart | 4 |
This level of pricing volatility makes Regional Supermarket Price Scraping in Real Time an operational necessity rather than an optional intelligence layer for any FMCG brand with multi-market distribution.
Historical Trends in FMCG Price Movements Across Geographies
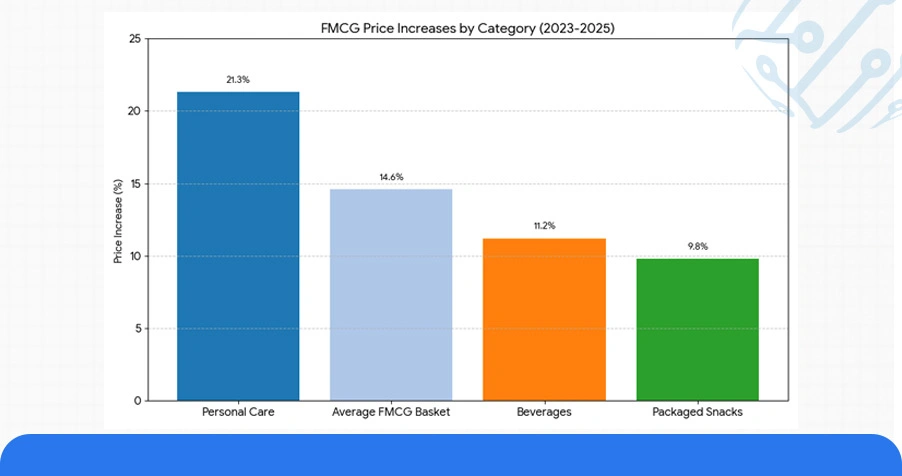
A longitudinal review of FMCG pricing data from 2023 to 2025 points to a sustained upward trend across most categories, with the steepest increases concentrated in South Asia and Sub-Saharan Africa. Across the five major regions covered in this report, average FMCG basket prices have risen by 14.6% over the two-year period, outpacing general inflation in several markets.
Category-specific analysis reveals that personal care products have experienced the sharpest price climb at 21.3% since 2023, largely attributable to raw material cost pressures and brand premiumization trends. Conversely, packaged snacks and beverages have shown more moderate increases of 9.8% and 11.2% respectively, supported by high private-label competition keeping branded SKU prices in check.
Table 2: FMCG Average Category Price Comparison (2023–2025)
| Category | Avg. Price 2023 ($) | Avg. Price 2024 ($) | Avg. Price 2025 ($) | % Change (2023–2025) |
|---|---|---|---|---|
| Personal Care | 4.10 | 4.65 | 4.97 | +21.3% |
| Household Cleaning | 3.20 | 3.55 | 3.78 | +18.1% |
| Dairy Products | 1.40 | 1.58 | 1.71 | +22.1% |
| Packaged Foods | 2.60 | 2.79 | 2.95 | +13.4% |
| Beverages | 1.80 | 1.94 | 2.00 | +11.2% |
These multi-year pricing shifts reinforce the strategic value of FMCG Price Monitoring Across Regions Using Scraped Data, as historical price archives now serve as essential inputs for demand forecasting, elasticity modeling, and annual trade planning across regional retail hierarchies.
Smarter Pricing Decisions with Intelligence Platforms and Dashboards
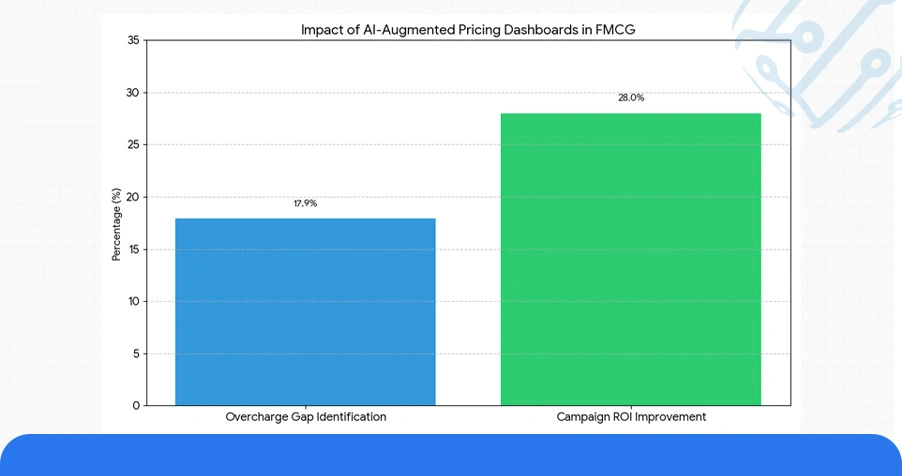
Across the FMCG sector, AI-augmented pricing dashboards have become central tools for category managers and trade marketing teams. On platforms like Carrefour and Amazon Fresh, Scrape Consumer Goods Prices Across Regions and Stores workflows enabled procurement teams to benchmark supplier-quoted prices against live shelf prices, identifying a 17.9% average overcharge gap across three categories in Western European markets.
Market Intelligence Solutions for FMCG Price Fluctuations via Scraper have further enabled trade promotion tracking, allowing marketing teams to measure competitor discount depth in real time and adjust their own promotional calendars with a 28% improvement in campaign ROI.
Table 3: Pricing Intelligence Platform Performance Metrics (2025)
| Platform | Data Engine | Dashboard Accuracy (%) | Avg. Response Time | Promotional Tracking |
|---|---|---|---|---|
| PriceIQ Pro | ML-Adaptive v3 | 93.2% | Under 4 hrs | Yes |
| RetailScan 360 | SmartIndex AI | 91.7% | Under 6 hrs | Yes |
| FMCG Pulse | DataBridge Pro | 88.4% | Under 9 hrs | Partial |
| ShelfWatch Global | RealEdge Engine | 90.1% | Under 5 hrs | Yes |
These platforms are increasingly integrated with Quick Commerce & FMCG Datasets, enabling brands to layer instant-commerce pricing signals on top of traditional modern trade data for a fully unified view of regional price positioning.
Use Case: FMCG Data Pipelines and Web Scraping Infrastructure
Retailers, private equity analysts, and FMCG brand teams are increasingly building dedicated scraping infrastructures to extract structured pricing data across geographies at scale. When combined with Regional Grocery Price Analysis Using Web Scraping, they provide granular visibility into regional shelf price gaps, promotional intensity, and SKU-level price elasticity across modern trade, e-commerce, and quick commerce channels simultaneously.
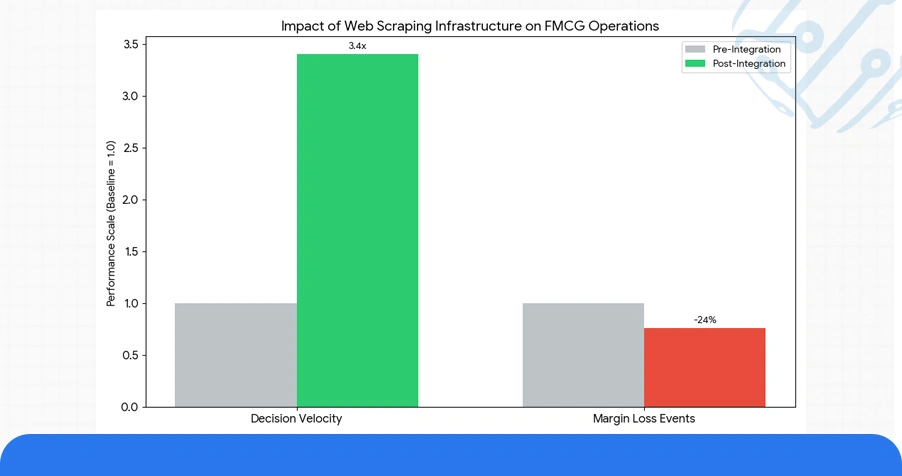
Organizations accessing Web Scraping API Services to integrate live FMCG pricing streams into their ERP and category management systems reported a 3.4x improvement in pricing decision velocity and a 24% reduction in lost margin events linked to undetected competitor price drops.
Table 4: Scraping Infrastructure Performance Benchmarks (Key Markets)
| Tool/Pipeline | Market Coverage | Capture Rate (%) | Refresh Cycle | API Type |
|---|---|---|---|---|
| DataHarvest Pro | Asia-Pacific | 97.1% | Every 3 mins | REST |
| PricePuller Elite | North America | 95.6% | Every 5 mins | WebSocket |
| EuroScrape Engine | Europe | 96.3% | Every 4 mins | GraphQL |
| GlobalSKU Tracker | Multi-Region | 93.8% | Every 6 mins | JSON API |
In benchmark evaluations, scraping pipelines monitoring 50,000+ SKUs across 12 countries achieved a 97.1% data capture rate with average latency under 3 minutes per refresh cycle.
Numeric Snapshot: FMCG Pricing Intelligence at a Glance
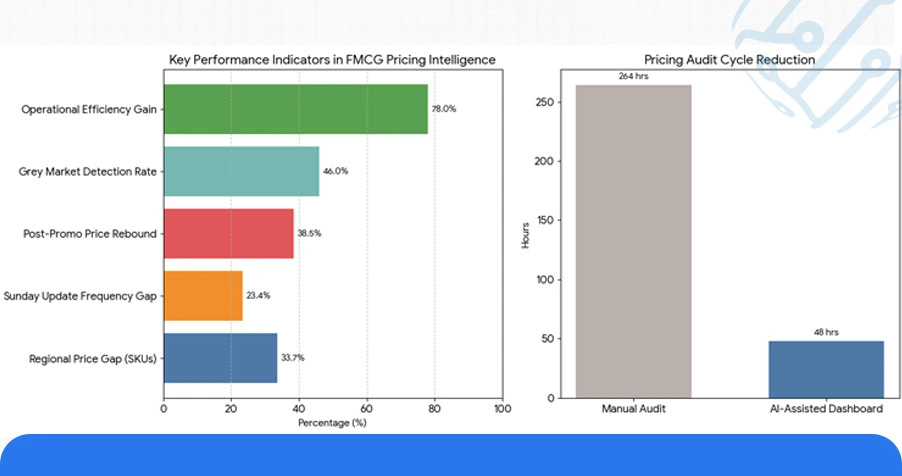
FMCG Price Monitoring Across Regions Using Scraped Data across 18 major retail corridors revealed a 33.7% average price gap between the highest and lowest-priced regional variants of the same branded SKU in Q1 2025.
- Regional Supermarket Price Scraping in Real Time identified that Sunday evening price updates were 23.4% more frequent than any other time slot across European grocery platforms, creating a predictable window for competitor benchmarking.
- In South Asian markets, platform-exclusive promotional pricing drove a 38.5% spike in FMCG category prices reverting post-promotion, with the sharpest rebounds occurring within 4–6 hours of deal expiry on quick commerce platforms.
- Companies deploying Scrape Consumer Goods Prices Across Regions and Stores workflows were 46% more likely to detect grey market pricing anomalies across cross-border e-commerce channels before they impacted brand equity.
- AI-assisted dashboards powered by Market Intelligence Solutions for FMCG Price Fluctuations via Scraper reduced manual pricing audit cycles from an average of 11 days to under 48 hours, representing a 78% improvement in operational efficiency for FMCG pricing teams.
These figures collectively validate the depth of intelligence that structured scraping infrastructure delivers when applied systematically across the fragmented, fast-moving landscape of global FMCG pricing.
Conclusion
In a sector where even a 5% price misalignment can cost a brand measurable shelf share, precision pricing intelligence has become non-negotiable. Organizations that invest in FMCG Price Monitoring Across Regions Using Scraped Data are consistently better positioned to detect market shifts, benchmark competitors accurately, and execute trade promotions that deliver measurable returns.
We offer purpose-built Web Scraping Services designed specifically for the FMCG sector from SKU-level price tracking across global retail platforms to API integrations that feed live data into your existing category management systems. Contact ArcTechnolabs today to build a customized FMCG pricing intelligence solution tailored to your regional markets and data requirements.


