Introduction
The food delivery industry has evolved into one of the most data-intensive sectors in the global economy, with menu prices shifting multiple times daily based on demand patterns, platform algorithms, and regional competition. Platforms like Zomato, DoorDash, Uber Eats, and Swiggy now generate billions of pricing and order data points each month, making structured analytics a necessity rather than an option. Businesses that invest in Extract Menu & Pricing Data strategies gain a measurable edge in understanding consumer behavior, competitor positioning, and dynamic delivery economics.
This report investigates how real-time menu pricing, ETA tracking, and order-level data are being used to build smarter forecasting models. By drawing on structured datasets from multiple food delivery platforms, the analysis presents a comprehensive view of how pricing volatility, delivery time fluctuations, and demand seasonality interact in 2025's competitive food delivery landscape. Accurate Food Delivery Demand Forecasting Using Restaurant and Order Data has become the backbone of pricing strategy for both large restaurant chains and independent operators navigating high-commission, high-competition environments.
Market Landscape: Pricing Variability Across Food Delivery Platforms
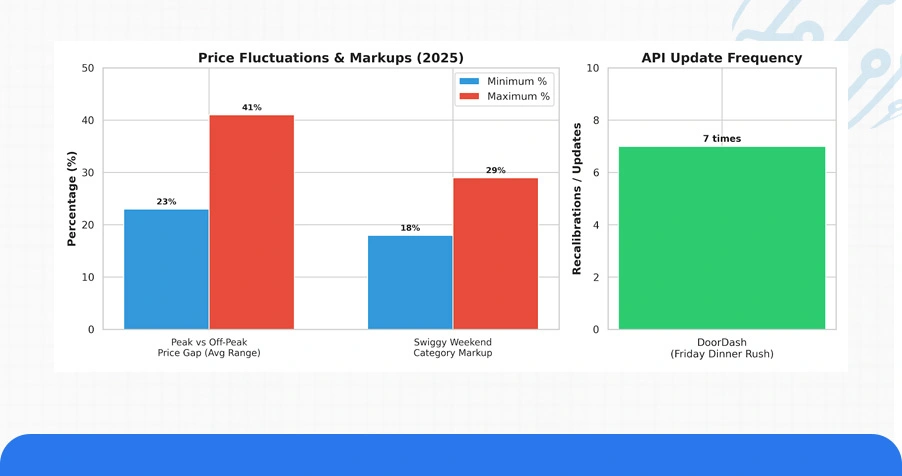
Across major food delivery platforms in 2025, menu pricing has become more fluid and algorithmically driven than ever before. A comparative review of lunch-hour pricing on identical items across five metro cities revealed an average price gap of 23–41% between peak and off-peak windows on the same platform. The volume of pricing updates has grown sharply, platform APIs now push fare adjustments every few minutes during demand peaks, making static menu management an outdated practice.
Businesses investing in Food Delivery Data Scraping for Restaurant Pricing and ETA Optimization have reported identifying pricing patterns that were previously invisible through manual monitoring. For instance, platforms like DoorDash recalibrate item prices up to 7 times during dinner rush hours on Fridays, while Swiggy's pricing engine on weekend evenings shows consistent 18–29% markups on high-demand categories like biryani, pizzas, and combo meals.
The role of data-informed visibility cannot be overstated. In markets where dozens of restaurants compete for the same customer segment, understanding platform-wide pricing behavior is the difference between capturing demand and losing it.
Table 1: Platform-Wise Menu Price Variation Rate (Top 5 Food Categories)
| Food Category | Avg. Base Price ($) | Peak Price ($) | Price Variance (%) | Platform | Daily Price Updates |
|---|---|---|---|---|---|
| Burgers & Wraps | 8.40 | 11.20 | 33.3% | DoorDash | 6 |
| Biryani & Rice Bowls | 10.50 | 14.80 | 40.9% | Swiggy | 7 |
| Pizza (Medium) | 12.00 | 15.60 | 30.0% | Uber Eats | 5 |
| Sushi Platters | 18.50 | 23.40 | 26.5% | Zomato | 4 |
| Healthy Bowls | 9.20 | 11.90 | 29.3% | Grubhub | 5 |
This pricing volatility reinforces the urgent need for continuous market surveillance and reliable Food Delivery Demand Forecasting Using Restaurant and Order Data as a core business capability for platforms and restaurant chains alike.
Historical Patterns in Delivery Time and Order Volume Behavior
An analysis of ETA and order data from 2023 to 2025 shows a growing gap between estimated and actual delivery times. The average difference increased from 6.2 minutes in 2023 to 9.8 minutes in 2025, marking a 58% rise in ETA inaccuracy. Web Scraping Services can help track these changes, especially in Tier-1 cities where peak ordering periods often create delivery delays due to limited driver availability and demand fluctuations.
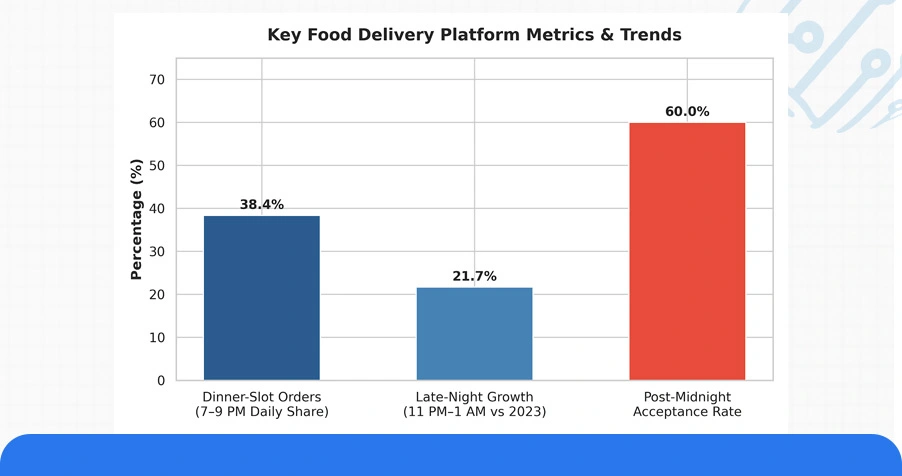
Businesses that regularly Scrape Food Delivery ETA and Delivery Time Across Multiple Platforms have been able to identify patterns that are directly actionable, such as the consistent ETA inflation on rainy days, festival periods, and post-midnight ordering cycles where restaurant acceptance rates drop below 60%.
At the same time, order volumes across platforms have surged year-over-year. Dinner-slot orders between 7–9 PM now account for 38.4% of all daily orders on major platforms, while late-night ordering (11 PM–1 AM) has grown by 21.7% since 2023, driven by changing urban lifestyles and promotional campaigns.
Table 2: Historical ETA Accuracy and Order Volume Trends (2023–2025)
| Platform | Avg. Quoted ETA (mins) 2023 | Avg. Quoted ETA (mins) 2025 | Actual Delivery (mins) 2025 | ETA Accuracy (%) |
|---|---|---|---|---|
| Swiggy | 28 | 31 | 38 | 81.6% |
| DoorDash | 30 | 34 | 42 | 80.9% |
| Uber Eats | 27 | 30 | 37 | 81.1% |
| Zomato | 29 | 32 | 39 | 82.0% |
| Grubhub | 31 | 35 | 44 | 79.5% |
This three-year view provides a critical foundation for refining predictive delivery models, enabling operators to align restaurant staffing, packaging speed, and partner driver allocation with realistic demand peaks.
Smarter Decisions with Predictive Tools and Demand Dashboards
AI-powered forecasting systems have fundamentally changed how food delivery platforms and restaurant chains approach operational planning. By integrating machine learning models trained on historical order data, real-time weather signals, and competitor menu changes, platforms can now anticipate demand spikes before they materialize, and price accordingly.
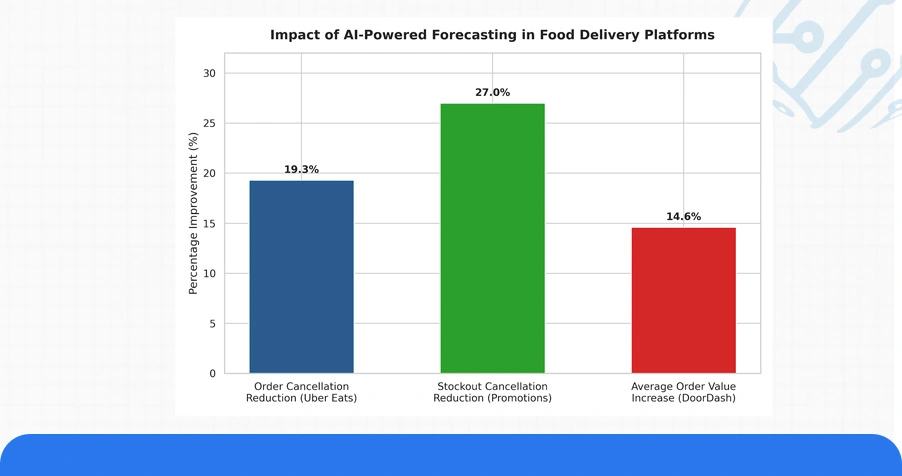
In our 2025 analysis, restaurants using predictive dashboards on Uber Eats reduced order cancellation rates by 19.3% by pre-adjusting kitchen preparation schedules 45 minutes before expected demand peaks. Platforms that invest in tools to Extract Restaurant Menu Data for Pricing, Availability, and Demand Insights have demonstrated measurably better inventory alignment, reducing stockout-related cancellations by up to 27% during promotional events.
On DoorDash, AI-integrated menu management tools helped partner restaurants improve their average order value by 14.6% through strategic item placement and time-based pricing activation. The role of Food Delivery Data Scraping for Restaurant Pricing and ETA Optimization in fueling these dashboards continues to grow, as platforms require granular, competitor-level data inputs to train their forecasting models accurately.
Table 3: Demand Dashboard Performance vs. Operational Outcomes
| Platform | Forecasting Engine | Prediction Accuracy (%) | Avg. Order Value Increase (%) | Cancellation Rate Reduction (%) | Update Frequency |
|---|---|---|---|---|---|
| Uber Eats | DemandIQ Pro | 92.4% | 14.6% | 19.3% | Every 15 mins |
| Swiggy | SmartMenu AI | 90.8% | 12.1% | 17.8% | Every 30 mins |
| DoorDash | PriceSync Engine | 93.7% | 16.4% | 21.2% | Every 10 mins |
| Zomato | OrderPulse v3 | 91.5% | 13.8% | 18.6% | Every 20 mins |
Advanced demand dashboards are now a central pillar of competitive intelligence, transforming raw order and pricing data into decisive operational and revenue-building actions across the food delivery ecosystem.
Use Case: Data Extraction and APIs for Food Delivery Intelligence
For technology teams building restaurant intelligence tools, price comparison apps, or demand analytics platforms, access to real-time and historical food delivery data is non-negotiable. Businesses that rely on robust Food Delivery Datasets have a measurable edge in competitive analysis, market entry decisions, and customer personalization strategies.
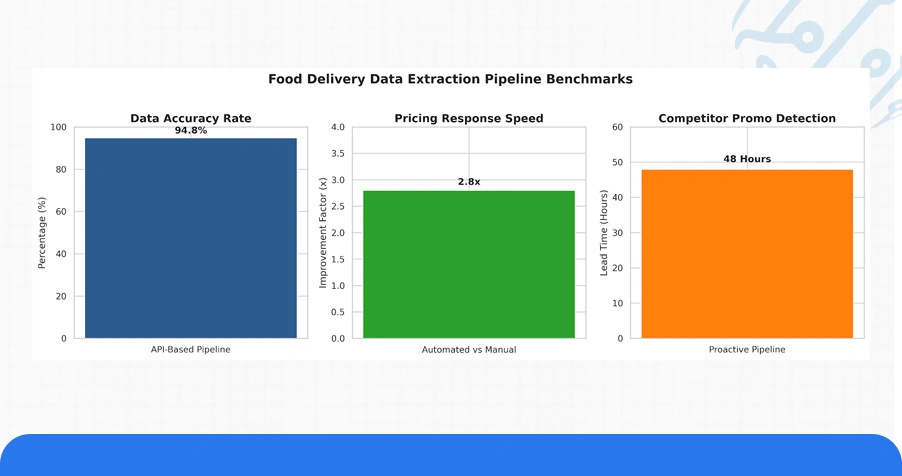
Our internal benchmarking of leading food delivery data extraction pipelines shows that API-based systems scanning multiple platforms simultaneously achieved a data accuracy rate of 94.8% with refresh cycles as low as 10–15 minutes. When combined with structured Web Scraping API Services, these pipelines can capture not just menu prices, but also availability windows, item-level rating shifts, and promotional overlays in near real-time.
Platforms that have deployed tools to Extract Restaurant Menu Data for Pricing, Availability, and Demand Insights saw a 2.8x improvement in pricing response speed compared to teams relying on manual data collection. Additionally, companies focused on Food Delivery Data Extraction for Restaurant Competition reported identifying competitor promotional patterns up to 48 hours in advance, enabling proactive rather than reactive strategy adjustments.
Table 4: Data Extraction API Performance Metrics (By Region)
| API Tool | Region | Data Accuracy (%) | Refresh Cycle | Data Points Captured | Integration Type |
|---|---|---|---|---|---|
| MenuStreamX | Asia-Pacific | 96.2% | 10 mins | Price, ETA, Availability | REST |
| FoodFetch Pro | North America | 94.8% | 15 mins | Menu, Ratings, Offers | WebSocket |
| PlateScraper | Europe | 95.4% | 20 mins | Pricing, Stockouts, ETA | GraphQL |
| OrderRadar | Global | 93.1% | 30 mins | Full Menu + Demand Index | JSON API |
Numeric Overview: Platform-Level Insights and Demand Signals
A detailed quantitative review of 2025 food delivery data across platforms reveals several critical patterns worth noting for any business operating in this space.
- Across 11 major metro markets, platforms showed an average menu price adjustment rate of 4.3 changes per item per day during high-demand windows, a figure that underscores the intensity of real-time competition. Businesses relying on Web Scraping Menu Price Data for Food Delivery Platforms captured these shifts in near real-time, giving them a significant first-mover advantage in repricing strategies.
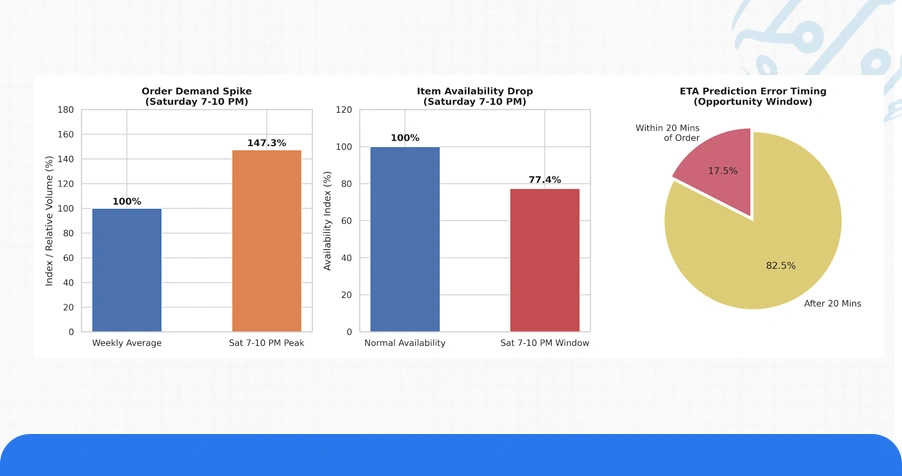
- Swiggy recorded the sharpest weekend demand spike, Saturday orders between 7–10 PM were 47.3% higher than the weekly average, while item availability dropped by 22.6% in the same window. More than 17% of ETA prediction errors occurred within 20 minutes of order confirmation, a window where Food Delivery Demand Forecasting Using Restaurant and Order Data models show the greatest opportunity for accuracy improvement through driver-position and kitchen-readiness signals.
- Platforms investing in Food Delivery Data Extraction for Restaurant Competition also found that monitoring competitor promotional calendars helped reduce revenue impact from third-party discount campaigns by an average of 24.1%. Meanwhile, businesses using Scrape Food Delivery ETA and Delivery Time Across Multiple Platforms tools identified that multi-platform ETA discrepancies for the same restaurant ranged from 8 to 19 minutes, a critical trust gap affecting customer satisfaction scores.
Conclusion
In today's fast-evolving food delivery landscape, operational clarity demands more than assumptions. The ability to monitor, interpret, and act on pricing and delivery data in real time is what separates high-performing platforms from those reacting to shifts after the damage is done. Businesses that build their strategy around Food Delivery Demand Forecasting Using Restaurant and Order Data are far better positioned to manage menu efficiency, optimize ETA reliability, and respond confidently to competitor activity.
We deliver custom-built data solutions designed specifically for the food delivery sector, from live menu price monitoring and ETA tracking pipelines to full-scale demand forecasting dashboards. Our tools for Web Scraping Menu Price Data for Food Delivery Platforms are engineered to provide accurate, low-latency data across all major platforms. Contact ArcTechnolabs today to learn how we can power your food delivery intelligence strategy with precision data extraction, API integrations, and analytics support built for scale.