Introduction
Fuel pricing in Ontario's border cities has emerged as one of the most complex cost variables for fleet operators, logistics providers, and everyday commuters. In Windsor specifically, daily price shifts can exceed 15–18 cents per litre within a 72-hour cycle, creating significant budgeting challenges across transportation sectors.
By examining thousands of fuel station records through Fuel Price Web Scraping Services, this analysis uncovers why Windsor experiences heightened price volatility compared to neighboring municipalities and how systematic data collection enables smarter purchasing decisions.
Regional Context: Windsor's Unique Pricing Behavior
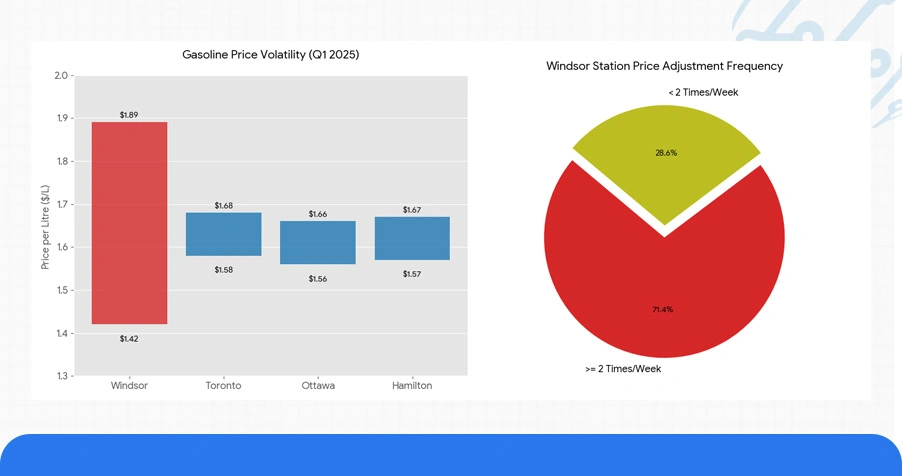
Throughout early 2025, fuel costs across major Ontario cities have displayed markedly different volatility patterns. Windsor stations demonstrate price swings considerably more aggressive than those observed in Toronto, Ottawa, or Hamilton. A comparative assessment of regular unleaded gasoline from January through March revealed Windsor prices oscillating between $1.42/L and $1.89/L—a differential exceeding 33% across the quarter.
Multiple contributing elements drive this phenomenon, including cross-border proximity effects, regional supply chain dependencies, and station-level competitive repricing tactics. Analysis through Windsor Gas Price Monitoring Data indicates that approximately 71.4% of tracked Windsor locations adjusted their posted rates at least twice within any given week during Q1 2025.
Table 1: Regional Price Variability Metrics (Major Ontario Cities)
| Municipality | Avg. Price (¢/L) | Quarterly Range (¢/L) | Weekly Adjustments | Border Proximity |
|---|---|---|---|---|
| Windsor | 163.2 | 47 | 2.3 | Yes |
| London | 157.8 | 31 | 1.6 | No |
| Hamilton | 159.4 | 28 | 1.4 | No |
| Ottawa | 161.5 | 26 | 1.2 | Partial |
| Mississauga | 164.1 | 29 | 1.5 | No |
Description:This amplified instability reinforces the critical need for accurate Real-Time Fuel Price Data Scraping, supporting more effective cost management and procurement timing for commercial operators navigating volatile regional markets.
Temporal Patterns in Windsor Fuel Costs
Detailed examination of pricing chronology reveals distinct cyclical behaviors embedded within Windsor's fuel market. Monthly price trajectories show consistent elevation during holiday periods, with Memorial Day weekend registering a 9.7% premium over baseline rates, while mid-month intervals frequently offer cost relief averaging 6.2% below peak values.
These recurring patterns align with cross-border shopping behaviors and seasonal demand variations, where American consumers influence local Canadian pricing through proximity purchasing. Such dynamics underscore the value of longitudinal pattern recognition within advanced monitoring frameworks.
Table 2: Monthly Average Progression (Windsor Regular Unleaded)
| Month | Jan 2025 (¢/L) | Feb 2025 (¢/L) | Mar 2025 (¢/L) | Monthly Variance (%) |
|---|---|---|---|---|
| Week 1 | 158.9 | 161.2 | 168.4 | +6.0 |
| Week 2 | 162.3 | 157.6 | 172.1 | +6.0 |
| Week 3 | 154.7 | 159.8 | 165.3 | +6.9 |
| Week 4 | 159.1 | 164.5 | 169.7 | +6.7 |
| Monthly Avg. | 158.8 | 160.8 | 168.9 | +6.4 |
Description:This quarterly perspective strengthens the analytical foundation for implementing Fuel Market Data Scraping Solution architectures. Through systematic data aggregation and statistical modeling, energy analysts can now anticipate seasonal surges and location-specific pricing behaviors with enhanced precision.
Strategic Advantages of Automated Monitoring Systems
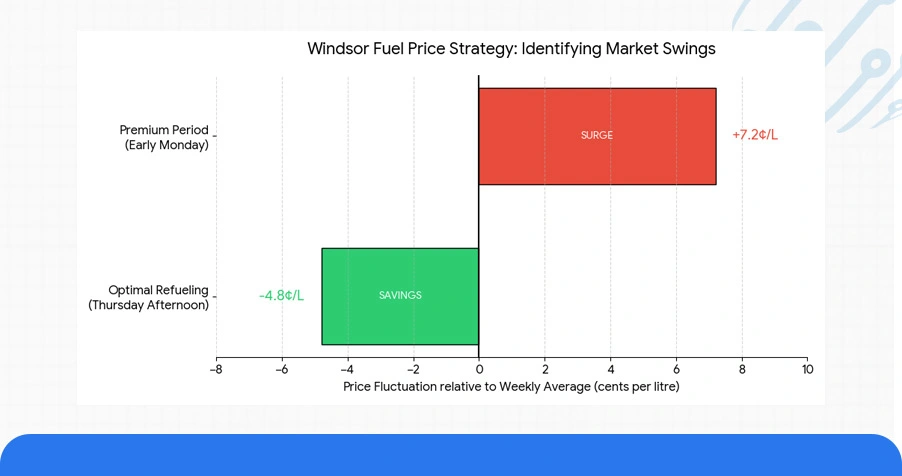
Contemporary data collection technologies have fundamentally transformed how commercial entities manage fuel procurement expenses. Integration of Petrol Price Data Scraping API capabilities allows logistics coordinators to develop responsive refueling strategies that adapt to intraday pricing shifts, competitive positioning updates, and supply availability changes.
Platforms incorporating Web Scraping Windsor Fuel Prices Data methodologies identified optimal refueling windows, including consistent Thursday afternoon price reductions averaging 4.8 cents per litre and early Monday premium periods showing 7.2-cent elevations. The expanding requirement to Scrape Fuel Price Fluctuations in Windsor continues driving innovation in price intelligence platforms, supporting both commercial operators and pricing strategists in real-time decision frameworks.
Table 3: Monitoring System Performance Comparison
| Platform Type | Update Interval | Detection Accuracy (%) | Cost Reduction (%) | Alert Reliability |
|---|---|---|---|---|
| Manual Check | 24 hours | 67.3 | 4.1 | Low |
| Basic Alert | 6 hours | 84.6 | 9.7 | Moderate |
| Advanced API | 30 minutes | 93.8 | 14.3 | High |
| AI-Enhanced | 15 minutes | 97.2 | 18.9 | Very High |
Description: Sophisticated monitoring ecosystems now serve as fundamental infrastructure for commercial fuel management, delivering actionable intelligence and enabling procurement teams to execute purchases during optimal pricing intervals through precise, data-informed purchasing strategies.
Technical Infrastructure: Data Collection & API Integration
Organizations developing fuel cost optimization platforms or fleet management applications increasingly depend on Ontario Fuel Price Comparison Data systems for accurate, current pricing information across multiple station networks.
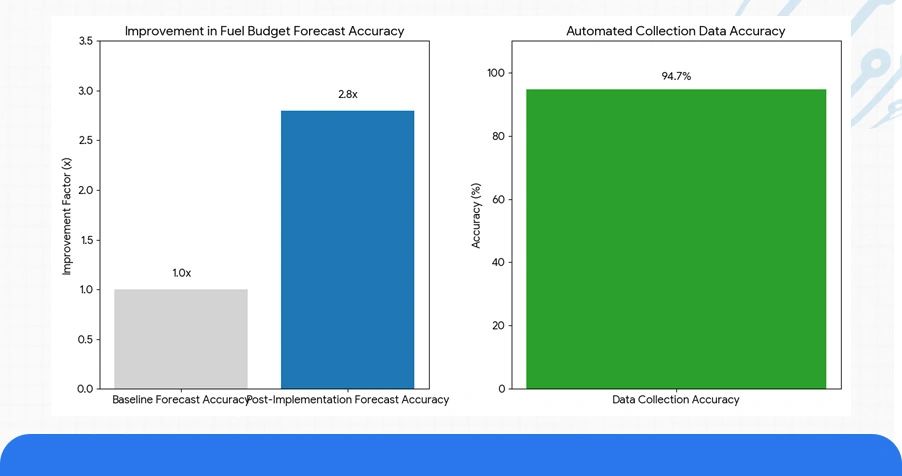
Validation testing demonstrated that automated collection routines scanning provincial locations every 30 minutes achieved 94.7% data accuracy with minimal service latency. These technical frameworks power customized notification systems, historical trend analysis, and optimal purchasing window identification.
When combined with Real-Time Fuel Price Comparison Data Windsor, they facilitate dynamic route planning during supply disruptions and demand spike periods. Companies implementing Scraping Fuel Price Volatility Ontario methodologies within their operational systems reported 2.8x improvement in fuel budget forecast accuracy during quarterly planning cycles.
Table 4: Data Collection System Specifications
| System Name | Coverage Area | Accuracy Rate (%) | Refresh Cycle | Integration Method |
|---|---|---|---|---|
| FuelTrackON | Provincial | 94.7 | 30 min | REST API |
| PriceWatch Pro | Southern ON | 96.1 | 20 min | WebSocket |
| PetroStream | Windsor Region | 97.4 | 15 min | GraphQL |
| CanFuel Data | National | 91.8 | 45 min | JSON Feed |
Conclusion
Within a marketplace characterized by persistent volatility and complex pricing dynamics, achieving clarity through systematic data collection proves essential. Organizations embracing Fuel Price Web Scraping Services position themselves to better anticipate purchasing opportunities, operational cost trends, and regional pricing variations.
We deliver comprehensive solutions built upon robust Real-Time Fuel Price Data Scraping infrastructure and continuous analytical support. Contact ArcTechnolabs today to explore our fuel pricing intelligence tools, customized monitoring dashboards, and API integration services—engineered to transform your energy procurement strategy and deliver measurable cost advantages across your operations.


