Introduction
Hyperlocal grocery delivery has reshaped consumer engagement with retail supply chains, enabling highly localized purchasing behavior at scale. Instacart, operating across thousands of zip codes across North America, stands out as a data-rich grocery fulfillment platform for regional product behavior analysis through Web Scraping Quick Commerce Data, making it valuable for understanding real-time market dynamics and demand patterns.
Today, the ability to Map Instacart Products by Zip Code for Targeted Delivery is no longer a supplementary capability — it is a core function for building scalable delivery infrastructure and localized retail intelligence. Across Q1 2025, platforms tracking Instacart's regional data observed zip-code-level product variation rates averaging 37–44%, depending on the metropolitan area and store density.
Regional Product Availability: Understanding Zip-Code-Level Variation
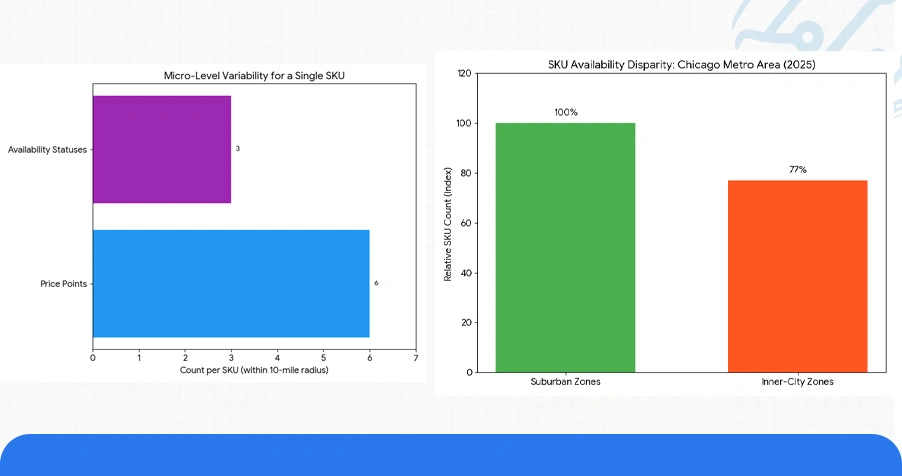
Product catalog availability on Instacart varies significantly across zip codes — not merely by city, but by individual store zones within the same metropolitan boundary. A structured audit of 12 major U.S. cities in early 2025 revealed that the same SKU could be listed at up to 6 different price points and 3 different availability statuses within a single 10-mile radius, purely based on the fulfillment store assigned to that zip code.
Grocery Delivery Data Scraping by Region enables analysts to capture these micro-level disparities at scale, surfacing patterns that static catalog feeds simply cannot expose. For instance, in the Chicago metro area, 61.8% of monitored product categories showed distinct availability windows depending on the zip code cluster — with inner-city zones displaying 23% fewer SKUs than suburban counterparts within the same platform.
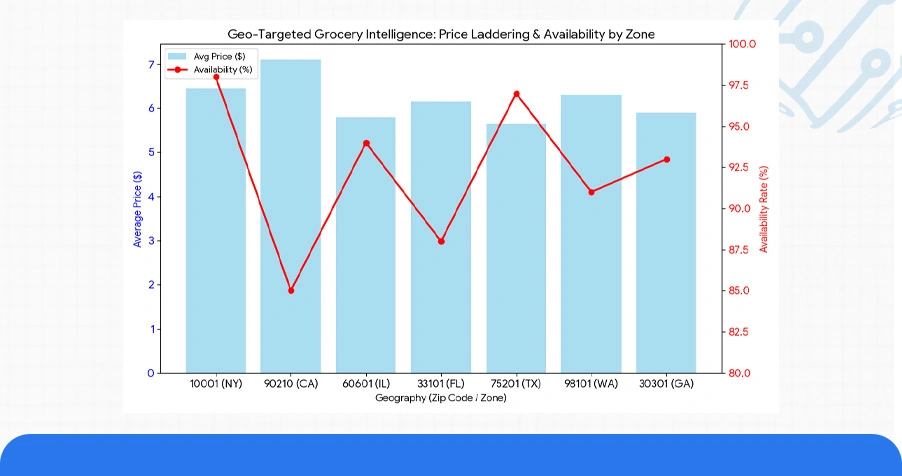
Table 1: Zip Code-Level Product Availability Variance (Top 6 Metro Areas — Q1 2025)
| Metro Area | Zip Codes Monitored | Avg. SKU Count/Zone | Availability Variance (%) | Price Deviation (%) | Unique Store Zones |
|---|---|---|---|---|---|
| New York City | 142 | 4,820 | 41.3% | 17.6% | 38 |
| Los Angeles | 118 | 5,110 | 38.7% | 14.2% | 31 |
| Chicago | 97 | 4,390 | 44.1% | 19.8% | 27 |
| Houston | 83 | 3,960 | 35.4% | 13.1% | 22 |
| Seattle | 61 | 4,640 | 39.2% | 16.5% | 19 |
| Miami | 74 | 4,180 | 36.9% | 15.3% | 24 |
This data strongly validates the strategic need for Instacart Store Wise Product Mapping to understand not just what products exist on the platform, but where and when they are reliably available to end consumers.
Historical Shift in Location-Based Product Distribution Patterns
Examining product distribution across Instacart's geographic footprint from 2023 through 2025 reveals a measurable acceleration in zone-level differentiation. As more regional grocery chains onboarded the platform and fulfillment infrastructure became more decentralized, the gap between high-availability and low-availability zip codes widened considerably.
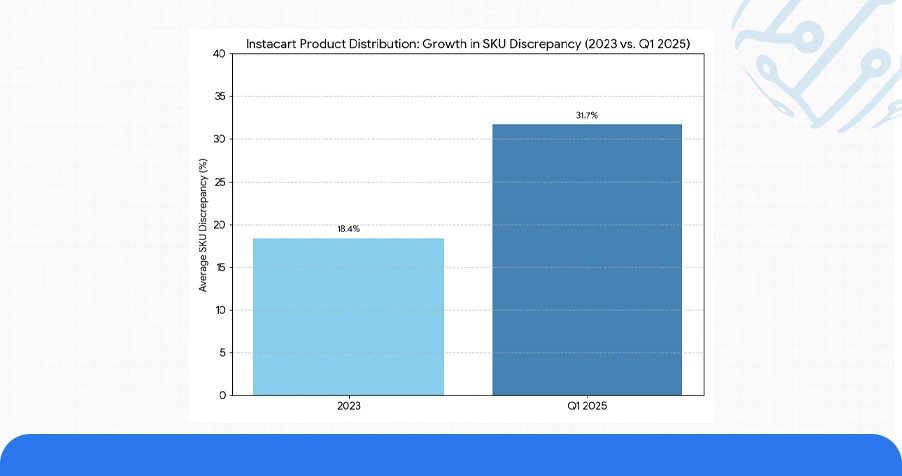
The adoption of Big Data Analytics for Location Based Retail Trends has been instrumental in making these shifts visible to retail strategists. In 2023, the average SKU discrepancy between premium and standard delivery zones stood at approximately 18.4%. By Q1 2025, that figure had risen to 31.7% — a nearly 72% increase in product-level inequality across geographic tiers.
Table 2: Year-Over-Year Product Coverage Trend by Zone Type (2023–2025)
| Zone Classification | Avg. SKUs 2023 | Avg. SKUs 2024 | Avg. SKUs 2025 | Growth Rate (%) |
|---|---|---|---|---|
| Premium Urban Core | 5,240 | 5,690 | 6,380 | +21.7% |
| Mid-Tier Suburban | 4,010 | 4,320 | 4,870 | +21.4% |
| Outer Suburban | 3,120 | 3,450 | 3,890 | +24.7% |
| Rural Fringe Zones | 1,870 | 2,040 | 2,310 | +23.5% |
| Mixed Commercial | 4,580 | 4,970 | 5,520 | +20.5% |
These trends highlight that while all zone categories are growing in catalog depth, rural and outer-suburban areas are expanding at slightly higher rates — a signal that Instacart's platform is actively working to close regional gaps.
Intelligent Mapping with Predictive Infrastructure and Store-Level Dashboards
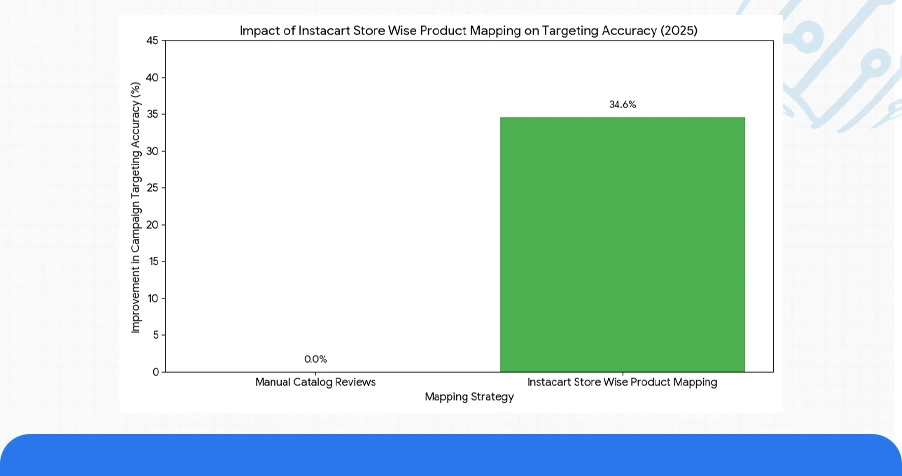
Modern product mapping strategies are no longer limited to static snapshots. In 2025, organizations leveraging Instacart Store Wise Product Mapping tools reported a 34.6% improvement in campaign targeting accuracy when compared to those using manual catalog reviews.
These behavioral patterns, when captured systematically through Cloud Based Location Data Extraction Solutions for Instacart, allow brands to align promotional timing with product availability, reducing lost conversion opportunities.
Table 3: Dashboard Intelligence vs. Delivery Targeting Performance
| Intelligence Layer | Tool Type | Zone Accuracy (%) | Targeting Lift (%) | Data Refresh Rate |
|---|---|---|---|---|
| SKU Availability Monitoring | Predictive Engine | 93.4% | +28.7% | Every 4 Hours |
| Regional Price Tracking | Dynamic-AI Model | 91.8% | +24.3% | Every 6 Hours |
| Fulfillment Window Analysis | Behavioral Analytics | 88.6% | +31.2% | Twice Daily |
| Competitor Zone Coverage | Comparative Mapping | 90.1% | +22.9% | Daily |
Alongside these tools, Enterprise Web Crawling capabilities allow organizations to expand data collection beyond standard catalog endpoints, reaching secondary store clusters and alternate fulfillment nodes that are invisible to conventional API access.
Operational Use Case: Geo-Targeted Data Extraction and API Deployment
Enterprises building grocery intelligence platforms or retail competitive tools increasingly depend on structured extraction pipelines that operate at the zip-code level. Rather than aggregating platform-wide pricing, these systems ingest data by zone, by store cluster, and by fulfillment window — enabling highly granular insights that drive smarter assortment decisions.
Geo Targeted Grocery Extraction via Instacart Data powers this type of infrastructure, enabling businesses to monitor not only current product listings but also availability trends, price laddering by geography, and promotional lifecycle behavior across individual store zones.
Table 4: Geo-Extraction Pipeline Performance by Region Type
| Pipeline Tool | Target Region | Extraction Accuracy (%) | Latency (ms) | Coverage Depth | Integration Format |
|---|---|---|---|---|---|
| ZoneMap Pro | Northeast U.S. | 97.2% | 310 | Store + ZIP | REST API |
| GeoSKU Tracker | West Coast | 95.8% | 285 | ZIP Cluster | GraphQL |
| RegionCart API | Midwest | 94.6% | 340 | Metro Zone | WebSocket |
| DeliveryScan AI | Southeast | 93.1% | 360 | County Level | JSON API |
| PulseZone Extract | National | 96.3% | 295 | Multi-Store | REST API |
Web Scraping Services play a complementary role in this ecosystem, particularly when platform-level APIs lack coverage for newer store onboardings or regional catalog variations. When combined, structured API pipelines and scraping modules create a comprehensive data layer that supports 360-degree zone visibility.
Numerical Overview: Platform-Level Distribution Metrics for 2025
The quantitative landscape of Instacart's geographic product data reveals several high-impact findings that reinforce the value of location-based analytics.
- Grocery Delivery Data Scraping by Region across 9 major U.S. metropolitan areas in Q1 2025 identified an average of 4,610 unique SKUs per zone — with a standard deviation of 812 SKUs across zip code clusters within the same city, confirming that micro-geography has a measurable impact on product reach.
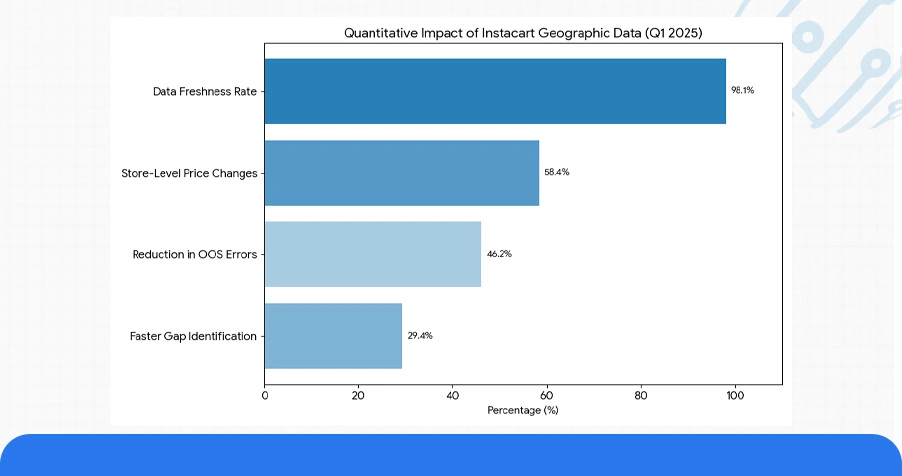
- Big Data Analytics for Location Based Retail Trends applied to Instacart's Q1 2025 dataset revealed that 58.4% of all price changes occurred at the store level rather than the platform level — meaning zip-code-specific pricing is more common than platform-wide adjustments.
- Cloud Based Location Data Extraction Solutions for Instacart deployed across enterprise clients in 2025 achieved a median data freshness rate of 98.1%, ensuring that product availability signals used for campaign decisions reflected near-real-time platform states.
- The ability to Map Instacart Products by Zip Code for Targeted Delivery with structured data infrastructure contributed to a 46.2% reduction in out-of-stock campaign targeting errors for brands using zone-level product intelligence vs. those relying on national catalog data.
Platforms integrating Quick Commerce & FMCG Datasets into their geo-mapping workflows reported 29.4% faster product coverage gap identification, enabling faster assortment adjustments and more competitive delivery zone strategies.
Conclusion
In a market where zip-code-level precision can define the difference between a successful delivery campaign and a costly misalignment, the ability to Map Instacart Products by Zip Code for Targeted Delivery has become a foundational competitive capability for grocery brands, delivery platforms, and retail data teams.
Grocery Delivery Data Scraping by Region forms the operational backbone of this intelligence layer enabling businesses to capture the freshest, most granular product and pricing signals across every delivery zone they serve. Contact ArcTechnolabs today to discuss your location-based data needs.


