Introduction
Business intelligence teams increasingly depend on external website data to understand pricing, products, competitors, customer preferences, and market movements. However, collecting information is only the first step. Businesses need reliable processes that convert raw web data into structured datasets that can support accurate dashboards, reports, and faster decisions across departments.
When automated extraction is combined with Enterprise Web Crawling, organizations can collect large volumes of information from multiple sources at scheduled intervals. Connecting these datasets with Power BI and Tableau creates a continuous analytical workflow, reducing repetitive spreadsheet preparation and improving reporting consistency.
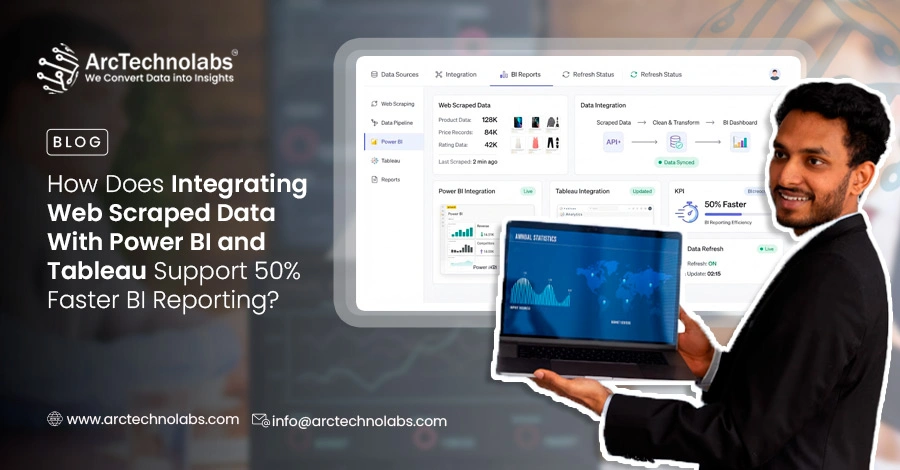
Integrating Web Scraped Data With Power BI and Tableau can also help organizations visualize changing business conditions through interactive dashboards. With appropriate validation, transformation, and refresh processes, teams can reduce reporting delays, compare market indicators efficiently, and potentially achieve reporting cycles that are up to 50% faster than heavily manual workflows.
Improving Reporting Speed Through Structured External Data Workflows
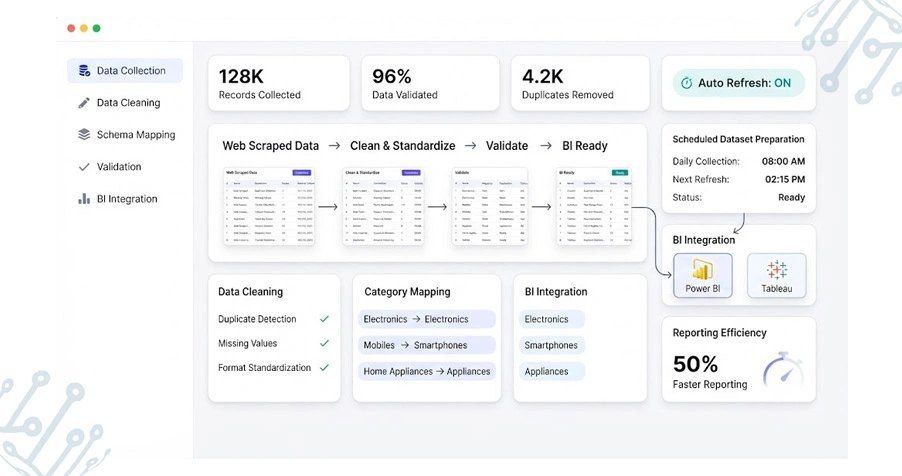
Raw website information frequently contains duplicate entries, inconsistent naming, missing values, and varying formats. Before analysts can use these records, they need a repeatable preparation workflow. Structuring Scraped Data for BI Tools helps establish consistent schemas, field names, identifiers, and data types, making information easier to process and visualize across recurring reporting cycles.
Organizations can also automate repetitive collection and preparation activities through Web Scraping Services, reducing the dependence on manual spreadsheet updates. Once information is standardized, analysts can connect it with internal business records and create reports around pricing, product catalogs, availability, or competitor movements. This can reduce time spent on routine preparation.
Key workflow improvements include:
- Automated recurring data collection
- Consistent field structures
- Duplicate record identification
- Standardized category mapping
- Scheduled dataset preparation
A well-organized workflow also improves reporting consistency because every refresh follows defined validation and formatting rules. Instead of repeatedly restructuring incoming records, teams can apply predefined processes for cleaning and categorization. This allows analysts to focus more attention on interpreting trends and less on correcting basic data-quality issues before each reporting cycle.
| Workflow Area | Primary Benefit |
|---|---|
| Collection | Reduces repetitive research |
| Standardization | Improves consistency |
| Validation | Supports data quality |
| Refresh | Shortens reporting delays |
Strengthening Dashboard Insights Through Diverse Data Sources
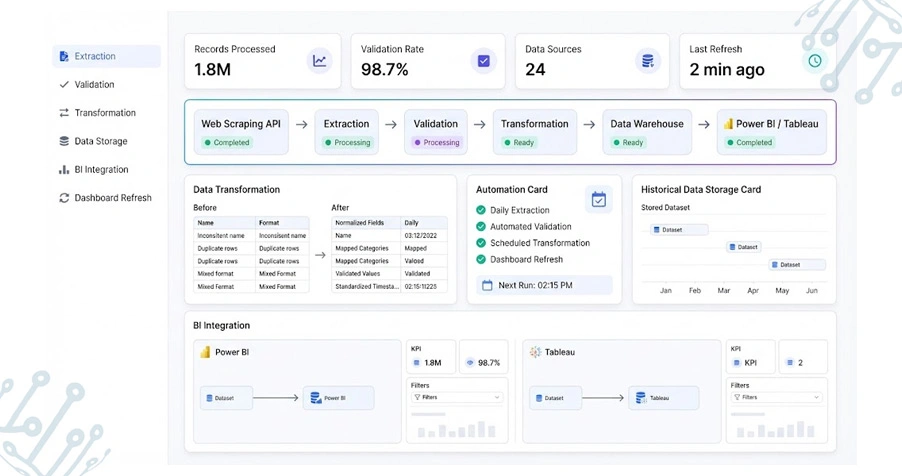
Interactive dashboards become more useful when external information is consistently prepared before visualization. Best Practices for Preparing Scraped Data for Tableau include standardizing categories, validating numerical values, removing duplicate records, and maintaining consistent timestamps. These steps help analysts create dependable views for comparing products, prices, competitors, and market trends.
Businesses can also combine website information with application-based sources through Mobile App Data Scraping Services, creating broader datasets for market analysis. When external records are combined with internal sales, inventory, or operational information, BI teams can build dashboards that provide a more complete view of changing business conditions and performance indicators.
Useful dashboard data components can include:
- Product information
- Competitor pricing
- Availability indicators
- Customer ratings
- Category information
Web Scraping Power BI and Tableau for Data Analytics can support interactive filtering, trend analysis, comparison charts, scorecards, and recurring performance views. Rather than reviewing disconnected spreadsheets, decision-makers can work with centralized visualizations that make changes easier to identify and communicate across business functions.
| Data Component | Reporting Application |
|---|---|
| Product Data | Catalog analysis |
| Pricing | Market comparison |
| Availability | Stock monitoring |
| Ratings | Customer analysis |
Creating Scalable Pipelines For Consistent BI Reporting
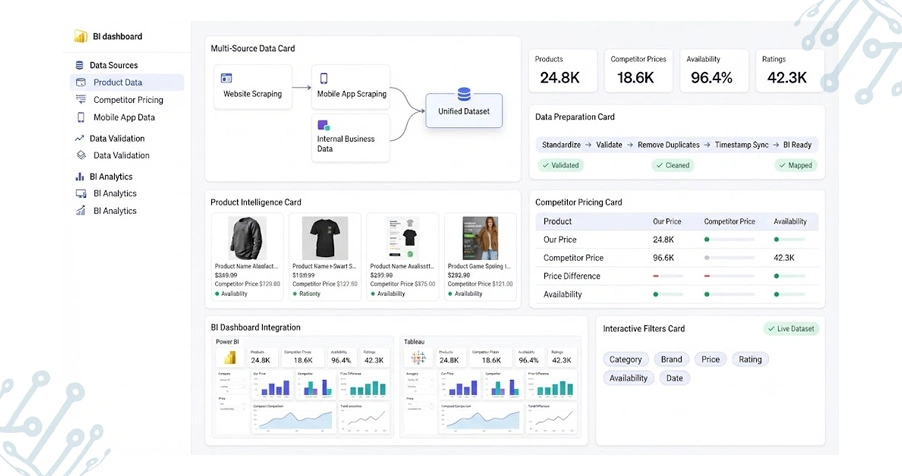
A scalable reporting environment requires coordinated extraction, validation, transformation, storage, and dashboard-refresh processes. Data Transformation of Web Scraped Data for Tableau helps convert inconsistent source structures into standardized datasets that can support calculations, comparisons, filters, and recurring visualization requirements across different reporting environments.
For Power BI workflows, Data Cleaning and Transformation for Power BI via Scraping can prepare records for relationships, measures, calculated fields, and scheduled refreshes. Meanwhile, Web Scraping API Services can provide repeatable delivery mechanisms that connect collection workflows with downstream storage and analytical systems without requiring constant manual file transfers.
A scalable pipeline can support:
- Automated extraction schedules
- Quality validation checks
- Standardized data models
- Historical data storage
- Recurring dashboard refreshes
Teams can also Clean and Structure Web Scraped Data for Tableau by applying normalization, deduplication, field mapping, and validation rules. These practices help reduce inconsistencies before information enters visualization systems. A standardized pipeline is especially useful when organizations process large datasets from multiple sources with different layouts and update frequencies.
| Pipeline Stage | Main Function |
|---|---|
| Extraction | Collects source records |
| Validation | Checks incoming information |
| Transformation | Standardizes structures |
| Storage | Maintains datasets |
| BI Refresh | Updates reports |
How ArcTechnolabs Can Help You?
We help businesses convert publicly available web information into structured, analysis-ready datasets for modern business intelligence environments. Integrating Web Scraped Data With Power BI and Tableau can become part of a streamlined workflow where extraction, processing, validation, and delivery are coordinated around reporting requirements.
Key ways we can support your BI workflow include:
- Designing customized data collection workflows around business requirements
- Collecting information from multiple publicly accessible digital sources
- Creating structured datasets suitable for analytical environments
- Applying validation and quality checks to extracted records
- Supporting scheduled collection and recurring dataset updates
- Delivering data in formats aligned with existing technology stacks
By combining automation with Data Cleaning and Transformation for Power BI via Scraping, organizations can establish more dependable reporting pipelines, reduce repetitive preparation work, and make external information easier to incorporate into regular business analysis.
Conclusion
A reliable external-data pipeline can significantly improve how organizations prepare, analyze, and visualize information. Integrating Web Scraped Data With Power BI and Tableau helps connect structured website data with interactive dashboards, making market comparisons, product monitoring, and performance analysis more accessible. Structuring Scraped Data for BI Tools further supports consistency by preparing information for repeatable reporting workflows.
When collection, validation, transformation, and visualization operate as connected stages, businesses can reduce manual reporting activities and respond to changing data more efficiently. Best Practices for Preparing Scraped Data for Tableau can further strengthen visualization readiness. Contact ArcTechnolabs to build a scalable web data pipeline tailored to your analytics requirements.