Introduction
Businesses today are overwhelmed with fragmented data scattered across dozens of platforms, tools, and digital sources. Without a structured approach to aggregating and visualizing this information, decision-makers are left guessing. We address this gap through Interactive Dashboard Development Using Web Scraped Data, transforming unstructured, multi-source information into clear and actionable visual intelligence that drives smarter decisions.
The demand for real-time visibility has pushed organizations to look beyond traditional reporting methods. Our Enterprise Web Crawling capabilities form the backbone of data collection, enabling automated extraction from hundreds of web sources simultaneously. This allows clients to move from reactive decisions to proactive strategies powered by continuously refreshed data.
Modern enterprises need more than raw numbers. They need context, patterns, and trends displayed in ways that non-technical teams can understand and act upon. We build end-to-end data pipelines that pull, clean, enrich, and deliver insights through dashboards that speak the language of business, not code.
The Client
A fast-growing retail analytics firm was managing data across e-commerce portals, logistics trackers, competitor websites, and social platforms yet none of these data streams were connected. Spreadsheets were outdated within hours and internal reports lacked the depth needed for confident planning. The client sought a partner capable of Interactive Dashboard Development Using Web Scraped Data to consolidate everything into one unified intelligence hub.
The firm operated across multiple product categories and geographies, making manual consolidation practically impossible. They needed Converting Scraped Data Into Interactive Dashboards that could reflect real conditions on the ground price shifts, stock availability, review sentiment, and competitor activity all in one view.
Their leadership team had invested in BI tools but lacked the structured data pipelines to feed them meaningfully. Without consistent, structured data flowing in, even the best visualization tools remained underutilized. We were brought in to solve exactly this, building the data foundation and the visual layer on top of it together.
Key Challenges
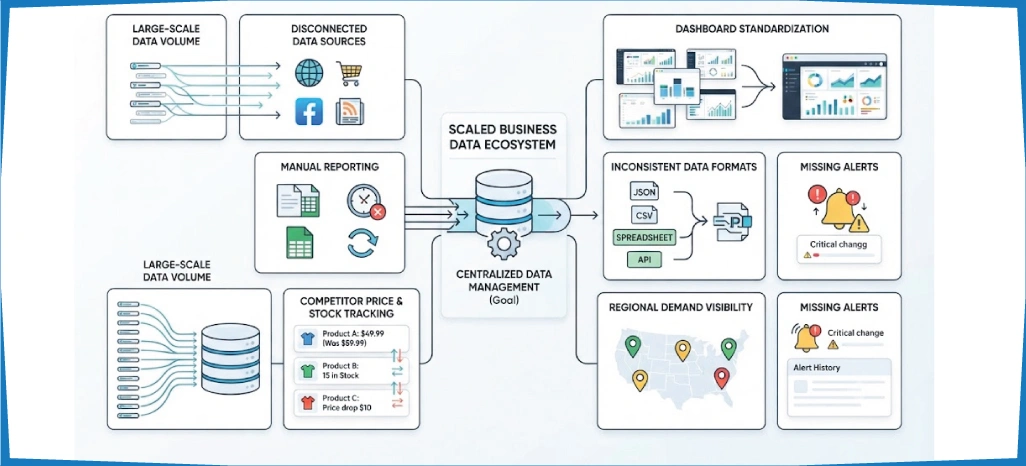
The client's data environment was deeply siloed, with no standardized formats or update schedules. Different departments relied on different sources, making unified reporting nearly impossible. Key obstacles included:
- Disconnected data sources with no centralized pipeline or ingestion framework
- Manual reporting cycles that produced outdated insights by the time they reached stakeholders
- Inability to track competitor pricing, promotions, and stock shifts in real time
- No structured process for Building Business Intelligence Dashboards From Scraped Data across product lines
- Inconsistent data formats from third-party platforms making consolidation difficult
- Limited visibility into regional demand variations affecting supply planning
- Absence of alert systems to flag critical changes in competitor behavior or platform rankings
The client also struggled with data volume. Building Dashboards for Large-Scale Scraped Datasets became a technical necessity, as the volume of incoming raw data from dozens of web sources far exceeded what conventional tools could handle without performance degradation.
Key Solution
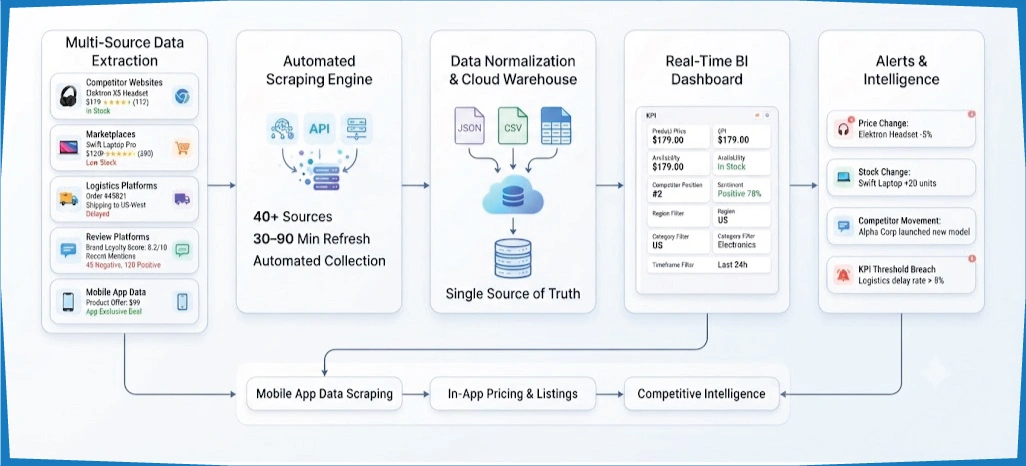
We designed a comprehensive data architecture that started with extraction and ended with visual delivery. Using its proprietary scraping engine alongside Web Scraping Services, the team built automated pipelines that collected structured data across competitor portals, marketplace listings, logistics platforms, and review aggregators on scheduled intervals.
- Custom scrapers for 40+ web and platform sources, refreshed every 30 to 90 minutes
- Data normalization layers that standardized formats across incompatible source structures
- A centralized cloud data warehouse that served as the single source of truth
- Creating Real-Time Dashboards From Web Scraped Data with drill-down filters by region, category, and timeframe
- KPI tracking modules covering pricing, availability, sentiment, and competitor positioning
- Automated alert systems triggered by threshold breaches in key metrics
For mobile-centric platforms, Mobile App Data Scraping Services enabled the team to extract in-app pricing and listing data that was unavailable via standard web endpoints. This gave the client a more complete competitive picture than most rivals could access.
Data Intelligence at a Glance
The following table summarizes the data domains covered, source types accessed, and the corresponding dashboard modules delivered as part of this engagement. Before building the dashboard layer, we mapped every data requirement to a specific extraction strategy.
This ensured that each visual module was backed by a reliable, refreshable data source rather than static exports. The structured mapping process also allowed the team to prioritize high-impact domains during the initial rollout phase.
| Data Domain | Source Type | Update Frequency | Dashboard Module |
|---|---|---|---|
| Competitor Pricing | E-commerce portals | Every 60 minutes | Pricing Intelligence Panel |
| Product Availability | Marketplace listings | Every 30 minutes | Stock Visibility Tracker |
| Customer Sentiment | Review platforms | Every 4 hours | Sentiment Analysis View |
| Logistics Performance | Delivery trackers | Every 2 hours | Fulfillment Metrics Board |
| Regional Demand | Category pages | Daily | Demand Heatmap Layer |
| Promotional Activity | Brand pages, ads | Every 90 minutes | Campaign Monitor Panel |
| Platform Rankings | Search result pages | Every 3 hours | Visibility Score Tracker |
Once the extraction and normalization layers were operational, the dashboards were connected directly to live data feeds. Stakeholders across marketing, supply chain, and strategy teams received role-specific views tailored to their reporting needs, enabling faster decisions without dependency on the data team for every query.
Advantages of Implementing ArcTechnolabs
-
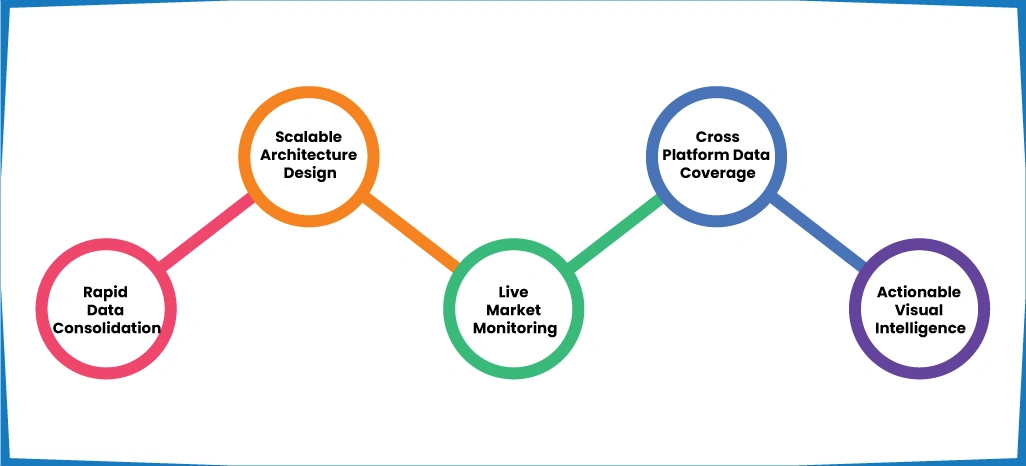
Rapid Data Consolidation
Our Converting Scraped Data Into Interactive Dashboards process merges multi-source data into unified views, eliminating silos and delivering structured intelligence ready for immediate business decision-making.
-
Scalable Architecture Design
Building Business Intelligence Dashboards From Scraped Data at scale is our core strength, supporting thousands of data points refreshed continuously without compromising platform performance or dashboard responsiveness.
-
Live Market Monitoring
Creating Real-Time Dashboards From Web Scraped Data ensures stakeholders always view current market conditions, competitor shifts, and demand signals without waiting for scheduled batch reports or manual updates.
-
Cross-Platform Data Coverage
Through Web Scraping API Services, we connect to diverse digital sources including marketplaces, review sites, logistics portals, and mobile apps, delivering comprehensive coverage across every relevant channel.
-
Actionable Visual Intelligence
Using Web Scraping for Data Visualization and Analytics transforms raw extracted data into intuitive charts, heatmaps, and KPI panels that non-technical teams can read, interpret, and act upon independently.
Client's Testimonial
ArcTechnolabs completely changed how we look at market data. Before this engagement, we were working with outdated numbers and gut instinct. Their approach to Interactive Dashboard Development Using Web Scraped Data gave our teams real visibility for the first time. The dashboards are intuitive, always current, and genuinely useful. Web Scraping and Dashboard Analytics Solutions have become central to how we plan every quarter now.
— Director of Business Intelligence, Retail Analytics Firm
Conclusion
Scattered data is not just an operational inconvenience it is a strategic liability that costs businesses time, money, and competitive advantage. Interactive Dashboard Development Using Web Scraped Data is how we help clients turn that liability into a measurable strength, replacing guesswork with structured, visual, always-refreshed intelligence.
Reach out to ArcTechnolabs to schedule a consultation and take the first step toward a smarter, data-driven operation built for scale. Building Dashboards for Large-Scale Scraped Datasets is not a one-size-fits-all exercise; it requires deep technical expertise, reliable extraction infrastructure, and a thorough understanding of how different teams use data.