.webp "How does McDonald’s Pickup-Only Price Analysis Using Data Scraping Uncovers 23% Beverage Price Variance?")
Introduction
Pricing in the fast-food industry is no longer static or uniform across locations. With pickup-only ordering becoming a major revenue channel, brands like McDonald’s are introducing subtle price variations that often go unnoticed by consumers but carry strong implications for operators and analysts. Beverage items, in particular, show meaningful differences across states, cities, and even neighboring outlets.
This is where McDonald’s Pickup-Only Price Analysis Using Data Scraping plays a strategic role. By systematically collecting menu and beverage pricing data from pickup-only digital menus, businesses can uncover real-time price variances, understand regional pricing logic, and identify anomalies that affect profitability and customer perception.
Advanced tools like Restaurant Data Scraping Services automate the process of collecting and structuring this information, enabling stakeholders to compare beverage prices across hundreds of U.S. locations instantly. Instead of reacting to pricing changes after the fact, companies can now anticipate trends, validate market hypotheses, and optimize pricing decisions using reliable datasets.
Understanding Regional Beverage Cost Variations
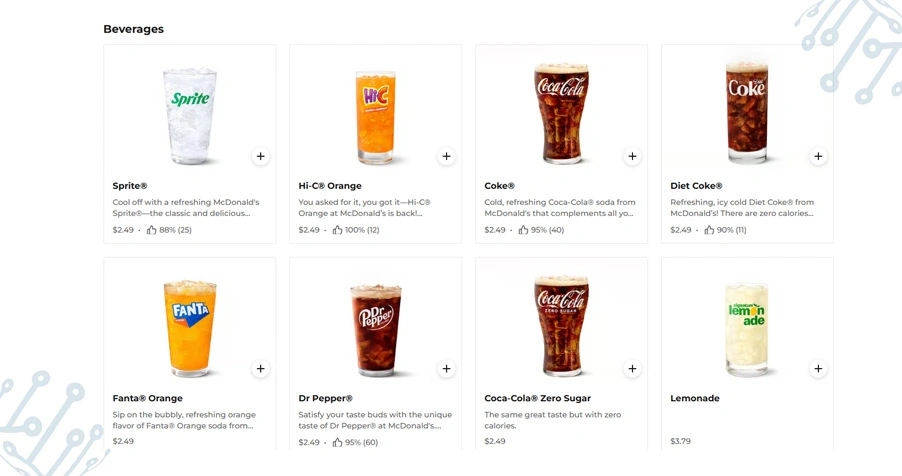
Beverage pricing across McDonald’s pickup-only menus shows measurable differences from one city to another. These variations are influenced by local operating costs, franchise autonomy, consumer demand sensitivity, and competitive pressure in specific micro-markets.
A systematic approach using McDonald’s Beverage Pricing Data Scraping allows analysts to collect standardized beverage prices across hundreds of U.S. outlets. This method ensures accurate SKU matching, size normalization, and removal of naming inconsistencies such as “M Coke” versus “Medium Coke.” Once unified, the dataset highlights how beverages fluctuate within and across regions.
For example, beverage prices in high-cost urban centers consistently trend higher than in suburban or rural markets. The presence of Powerful Restaurant Datasets further enhances this insight by allowing stakeholders to segment pricing by ZIP code, metro area, or franchise cluster.
Sample Regional Beverage Pricing Snapshot:
| City | Beverage Item | Pickup Price ($) | Regional Average ($) | Variance (%) |
|---|---|---|---|---|
| Dallas, TX | Medium Coke | 1.49 | 1.62 | -8.0% |
| Los Angeles | Medium Coke | 1.85 | 1.62 | +14.2% |
| Chicago | Medium Coke | 1.69 | 1.62 | +4.3% |
| Miami | Medium Coke | 1.75 | 1.62 | +8.0% |
By converting raw menu listings into region-indexed pricing intelligence, businesses gain a precise view of how localized pricing strategies impact both margins and customer trust. This segmentation enables brands to identify underperforming price zones and overperforming premium zones with clarity.
Comparing Beverage Prices Across Competitors
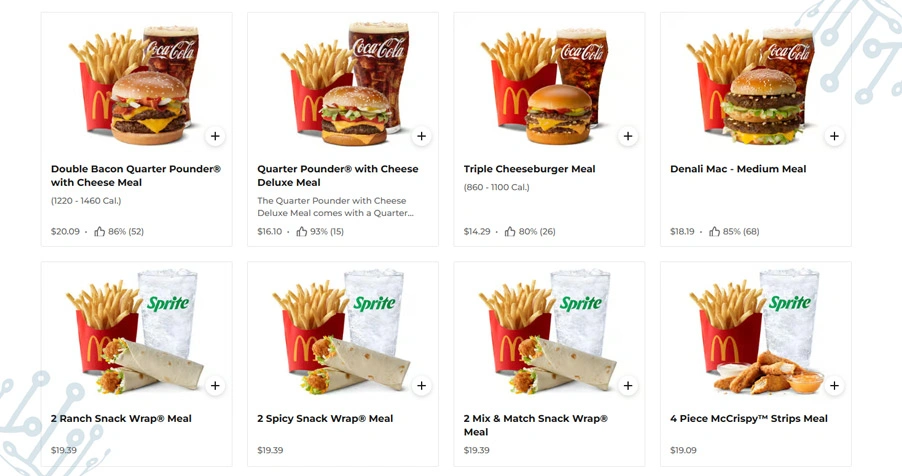
Understanding internal pricing differences is only part of a complete pricing strategy. True market clarity comes from comparing McDonald’s beverage prices against rival fast-food brands operating in the same regions. This competitive lens exposes whether pricing decisions are aligned with category norms or drifting into premium territory without a value narrative.
Through structured scraping workflows, analysts can perform a Fast Food Beverage Price Comparison that benchmarks pickup-only beverage prices across major QSR chains. This reveals where McDonald’s holds a price advantage, where it matches the market, and where it risks losing price-sensitive consumers. For instance, when national averages are analyzed, McDonald’s medium beverages often sit slightly above category means.
In several metro areas, these premiums range from 4% to 11% versus comparable items at Burger King or Wendy’s. These variances become strategically important when customers can instantly compare prices across apps. This pricing intelligence supports broader Fast Food Pricing Analysis USA frameworks by showing how localized McDonald’s prices behave relative to the wider fast-food ecosystem.
Sample Competitive Beverage Benchmark Table:
| Brand | Beverage Size | Avg Pickup Price ($) | Market Rank |
|---|---|---|---|
| McDonald’s | Medium | 1.62 | 2 |
| Burger King | Medium | 1.55 | 3 |
| Wendy’s | Medium | 1.49 | 4 |
| Sonic | Medium | 1.75 | 1 |
When paired with broader Fast Food Market Analysis USA, these comparisons help brands refine pricing bands, evaluate promotional timing, and prevent revenue leakage caused by misaligned local pricing strategies. It also uncovers anomalies where a single store’s beverage pricing deviates sharply from both competitor norms and internal averages.
Automating Digital Menu Price Monitoring
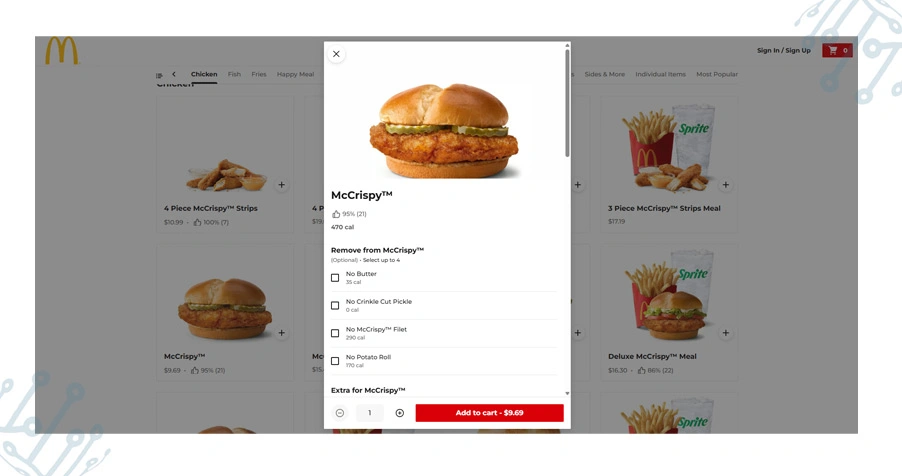
Manual tracking of beverage prices across hundreds of digital menus is inefficient and unreliable. Pickup-only prices can change frequently due to promotions, franchise updates, or operational cost adjustments. Without automation, these changes often go unnoticed until revenue or order volume is already affected.
Automated pipelines built around Web Scraping Restaurant Menu Prices eliminate this blind spot by capturing beverage pricing at scheduled intervals. These systems standardize SKUs, log historical price points, and flag unusual shifts in near real time. By feeding scraped pricing data into dashboards or analytics tools, businesses can generate alerts for sharp increases, sudden drops, or prolonged price stagnation.
This creates an early-warning system for pricing risks and revenue inconsistencies across franchise clusters. Automated monitoring also enables long-term trend modeling. Over time, this historical data becomes a strategic asset for forecasting revenue performance and optimizing price elasticity strategies.
Sample Automated Price Monitoring Output:
| Date | Store ID | Beverage Item | Pickup Price ($) | Change vs Last Week |
|---|---|---|---|---|
| 2026-01-01 | 10321 | Medium Coke | 1.59 | +0.05 |
| 2026-01-08 | 10321 | Medium Coke | 1.62 | +0.03 |
| 2026-01-15 | 10321 | Medium Coke | 1.62 | 0.00 |
| 2026-01-22 | 10321 | Medium Coke | 1.69 | +0.07 |
With continuous digital tracking, organizations move from reactive pricing decisions to proactive strategy optimization powered by real-time beverage intelligence.
How ArcTechnolabs Can Help You?
Using McDonald’s Pickup-Only Price Analysis Using Data Scraping, we help businesses uncover hidden pricing gaps, regional inconsistencies, and competitor misalignments. Our solutions integrate seamlessly with your analytics stack, enabling automated reporting, benchmarking dashboards, and pricing alerts tailored to your business objectives.
Our Key Capabilities Include:
- High-frequency menu price monitoring.
- Regional pricing variance mapping.
- Competitor benchmarking frameworks.
- Historical trend analysis pipelines.
- API-ready structured datasets.
- Custom reporting and visualization layers.
Our expertise in McDonald’s Beverage Pricing Data Scraping ensures you receive consistent, clean, and actionable datasets built for real-world business use.
Conclusion
Beverage pricing is no longer a simple menu line item—it is a strategic lever that influences customer perception, order frequency, and franchise performance. By applying McDonald’s Pickup-Only Price Analysis Using Data Scraping, businesses can clearly see where pricing diverges, why it happens, and how it impacts both competitiveness and profitability across U.S. markets.
When combined with Fast Food Market Analysis USA, scraped pickup-only data empowers brands and analysts to benchmark performance, anticipate pricing risks, and optimize beverage strategies with confidence. Partner with ArcTechnolabs today to build a smarter, faster, and more accurate pricing analytics ecosystem tailored to your business goals.


