Introduction
India’s Tier 2 and Tier 3 cities have become the new battlegrounds for online retail. This research dives deep into Meesho order datasets to understand the evolving purchase behavior, regional product demand, and pricing patterns in these fast-growing markets. By analyzing order-level insights, we reveal how data-backed strategies can help brands tap into unmet demand and optimize supply chains.
Understanding Regional Buying Behavior with Meesho Order Datasets
Meesho order datasets provide highly granular data including product category, order volume, delivery region, price band, and seller profile. These insights offer a transparent view of what drives consumer preferences in smaller Indian cities.
Using the Meesho Product and Review Dataset, we observed distinct demand patterns across categories like fashion, kitchenware, and local handicrafts. These regions often respond better to low-cost, bundled offerings rather than individual high-ticket products.
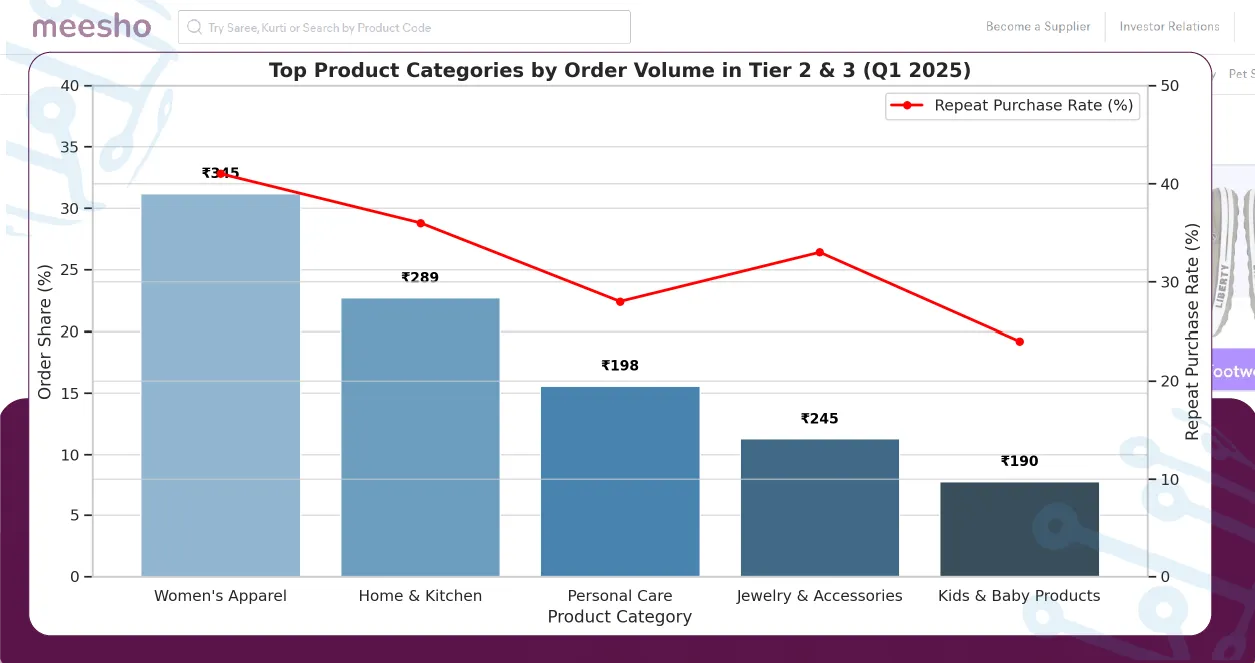
Table 1: Top Product Categories by Order Volume in Tier 2 & 3 (Q1 2025)
| Product Category | Order Share (%) | Avg. Price (₹) | Repeat Purchase Rate |
|---|---|---|---|
| Women's Apparel | 31.2% | 345 | 41% |
| Home & Kitchen | 22.7% | 289 | 36% |
| Personal Care | 15.6% | 198 | 28% |
| Jewelry & Accessories | 11.3% | 245 | 33% |
| Kids & Baby Products | 7.8% | 190 | 24% |
Analysis
Meesho order datasets reveal that women’s apparel dominates Tier 2 & 3 market demand. Despite the low average price, the repeat purchase rate indicates strong customer retention. Home and kitchen categories show a balance of affordability and frequency, making them high-potential segments for regional sellers.
Price Sensitivity & Discount Behavior
Exploring Meesho Product Datasets highlighted price as a major decision factor for online shoppers in smaller cities. The Online Shopping dataset shows that even slight pricing differences can significantly impact conversion rates.
Table 2: Pricing Elasticity for Top 3 Categories (2025)
| Category | Price Drop (%) | Order Increase (%) |
|---|---|---|
| Women's Apparel | -10% | +26% |
| Personal Care | -15% | +33% |
| Kitchen Items | -5% | +14% |
Analysis
A 10–15% price drop results in a substantial rise in order volume. The Online Shoppers Purchasing Intention Dataset supports this correlation, reinforcing the need for optimized pricing strategies based on Meesho order data.
Insights from Review Trends
Using the Mesho Shopping App Reviews Dataset and Meesho Reviews Scraper, we analyzed over 2 million reviews to detect common themes in customer satisfaction. Product quality, delivery speed, and customer support were key concerns.
Table 3: Top 5 Review Themes from Tier 2/3 Cities (2025)
Analysis
Review data shows recurring issues with product quality and delivery delays. These insights from the Meesho Reviews Scraper can help sellers improve offerings and logistics, especially in Tier 2 & 3 regions where customer trust is still building.
Seasonal & Festival-Based Purchase Behavior
Table: Meesho Festival Order Surge – 2025 (Tier 2 & 3 Cities)
| Festival | Avg. Order Spike (%) | Top Categories |
|---|---|---|
| Diwali | +68% | Ethnic Wear, Home Decor |
| Raksha Bandhan | +44% | Jewelry, Gift Hampers |
| Eid | +52% | Festive Apparel, Kitchen Items |
| Makar Sankranti | +31% | Sarees, Pooja Essentials |
| Christmas/New Year | +36% | Party Wear, Lights, Decor |
Analysis
Using the Online Shopping dataset, Meesho experiences seasonal peaks in Tier 2 & 3 cities, with up to 68% increase during Diwali. Ethnic wear, gift bundles, and home decor dominate during these events. Planning product launches and marketing around these peaks ensures optimized inventory turnover and higher profitability.
Seller Performance Benchmarking
Table: Top Seller Metrics by Region (2025)
| Region | Avg. Fulfillment Time (Days) | Return Rate (%) | Customer Rating (Out of 5) |
|---|---|---|---|
| West Bengal | 2.3 | 6.1 | 4.4 |
| Gujarat | 2.1 | 5.3 | 4.5 |
| Punjab | 2.7 | 7.8 | 4.2 |
| Bihar | 3.2 | 9.4 | 3.9 |
| Odisha | 2.9 | 8.6 | 4.0 |
Analysis
Through Meesho order datasets, seller performance varies by region. Gujarat and West Bengal stand out for faster deliveries and high ratings. Brands can use this benchmarking to identify high-efficiency regions and either partner with or model successful sellers to improve service consistency in less performing areas.
Regional Language & UX Preferences
Table: Impact of Regional Language Listings on Conversions (2025)
| Language Used | Avg. Conversion Rate (%) | Bounce Rate (%) |
|---|---|---|
| Hindi | 8.4 | 22 |
| Tamil | 9.1 | 20 |
| Bengali | 7.9 | 24 |
| English Only | 5.6 | 31 |
Analysis
Insights from the Mesho Shopping App Reviews Dataset show multilingual listings boost conversion rates by 30–60%. Tamil and Hindi content leads to reduced bounce rates and better user retention. Brands selling via Meesho can localize listings to enhance relevance and increase conversion across Tier 2 and Tier 3 cities.
Mobile-First User Behavior
Table: Device Preference Among Meesho Users (2025)
| Device Type | User Share (%) | Avg. Order Value (₹) | App Retention (30 Days) |
|---|---|---|---|
| Android | 79.3 | 372 | 63% |
| iOS | 3.5 | 490 | 58% |
| Web Browser | 17.2 | 405 | 44% |
Analysis
According to data from our Mobile App Scraping Services, nearly 80% of Meesho users in Tier 2 & 3 markets use Android devices. App-based users show higher retention and slightly lower average order values, indicating mobile-first, price-conscious buyers. Brands must focus on app UX optimization to drive loyalty.
Competitor Product Gap Analysis
Table: Product Category Gaps in Meesho Tier 2 & 3 Listings (2025)
| Product Segment | Availability Score (1–10) | Search Volume (Monthly) |
|---|---|---|
| Plus-Size Ethnic Wear | 4.2 | 18,000 |
| Eco-Friendly Kitchen Tools | 3.8 | 13,500 |
| Men’s Grooming Combos | 5.1 | 9,800 |
| Toddler Feeding Essentials | 4.5 | 7,400 |
Analysis
Using Exploring Meesho Product Datasets, ArcTechnolabs identified categories with high search volumes but low product availability. These represent lucrative white spaces. Sellers can target these product gaps to quickly dominate underserved niches, with the added advantage of less competition and early customer loyalty.
Optional Add-On: Cross-Platform Comparison Insight
Table: Cross-Platform Pricing for Identical SKUs (Meesho vs. Amazon/Flipkart – 2025)
| Product | Meesho Price (₹) | Amazon Price (₹) | Flipkart Price (₹) |
|---|---|---|---|
| Cotton Kurti | 299 | 379 | 359 |
| Mixer Grinder | 1,199 | 1,499 | 1,449 |
| Oxidized Earrings | 149 | 199 | 189 |
| Storage Containers | 229 | 289 | 279 |
Analysis
With Web Scraping ECommerce Data , Meesho consistently undercuts major marketplaces by 15–25% in Tier 2 & 3 regions. Lower prices help attract price-sensitive users but come with higher expectations on delivery and quality. Sellers must maintain balance between affordability and service quality.
The ArcTechnolabs Advantage
At ArcTechnolabs, we Scrape Meesho Product Data using ethical and scalable techniques, ensuring structured data for competitor analysis, trend forecasting, and personalized marketing. Through Web Scraping Meesho Product Data and Web Scraping ECommerce Data, we provide brands with clean, real-time information for deeper insights.
Our team also specializes in Mobile App Scraping Services to track app-specific deals and regional offers that don’t always appear on the web platform.
With our deep experience in data engineering and market research, ArcTechnolabs delivers high-quality, actionable datasets. Our solutions go beyond just providing raw data—we enable smarter decisions across pricing, inventory, and marketing strategies using advanced tools built around Meesho Product Datasets.
Conclusion
Tapping into India’s next billion users starts with understanding their behavior. By leveraging Meesho order datasets, brands can decode hyperlocal preferences, pricing sensitivity, and customer sentiment in untapped markets. Get in touch with ArcTechnolabs today to gain access to custom dashboards and live analytics for actionable insights.
Contact us now to unlock data-driven growth in Tier 2 & 3 markets!


