Introduction
Real estate decisions increasingly depend on timely, location-specific, and structured market information. Buyers, investors, brokers, property managers, and developers need more than scattered listings to understand changing demand, pricing movements, inventory levels, and neighborhood performance. Markets such as New York and California are particularly complex because property values differ sharply across cities, districts, property types, and buyer segments.
Collecting and analyzing listing information at scale helps businesses replace assumptions with measurable market intelligence. New York and California Property Listings Data Scraping helps organizations capture publicly available listing details from relevant real estate platforms, including property prices, square footage, amenities, location, listing status, agent details, rental values, and historical changes.
Reliable Real Estate Data Scraping Services also make it easier to organize high-volume property information into clean datasets for reporting, forecasting, portfolio planning, and investment evaluation. Property listing intelligence allows real estate professionals to track market changes continuously, compare assets accurately, and develop strategies aligned with real buyer and renter behavior.
Mapping Rental Activity Across High Potential Locations
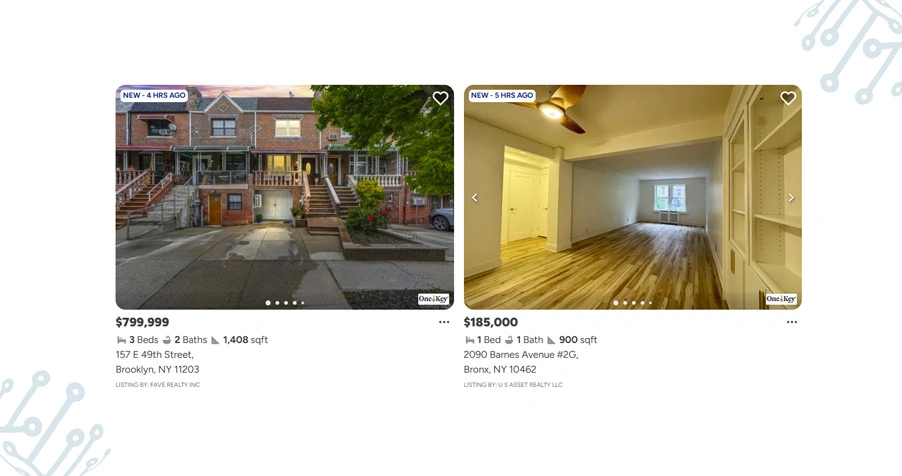
Real estate teams often need a clearer view of rental demand, commercial availability, and neighborhood-level opportunities before making location-based decisions. In large markets, reviewing listings individually can create delays and leave important supply changes unnoticed.
Commercial planners can use Real Estate Shops for Rent Datasets within ongoing research to compare retail spaces by rent, area, locality, visibility, and lease availability. This information supports expansion planning by helping brands evaluate nearby competition, accessible locations, and suitable commercial opportunities.
Rental activity can shift because of employment growth, education hubs, transit access, tourism, infrastructure projects, and changing population patterns. A scalable workflow using a Property Listings Scraper API for Real Estate Analytics can deliver standardized records into dashboards, databases, or internal reporting tools.
| Market Challenge | Data Collected | Business Value |
|---|---|---|
| Limited rental visibility | Monthly rent, lease status, property type | Identifies high-demand rental segments |
| Commercial vacancy tracking | Shop size, location, listing availability | Supports location planning |
| Neighborhood comparison | Price per square foot, amenities, nearby facilities | Improves investment evaluation |
| Listing turnover analysis | Listing date, status updates, removed listings | Measures market activity |
Reliable listing records also help agencies identify fresh rental leads and help property owners respond to changing market conditions. With better visibility into supply and demand, organizations can prioritize promising locations, reduce manual research, and develop rental strategies based on current market evidence.
Tracking Listing Price Movements Across Competitive Regions
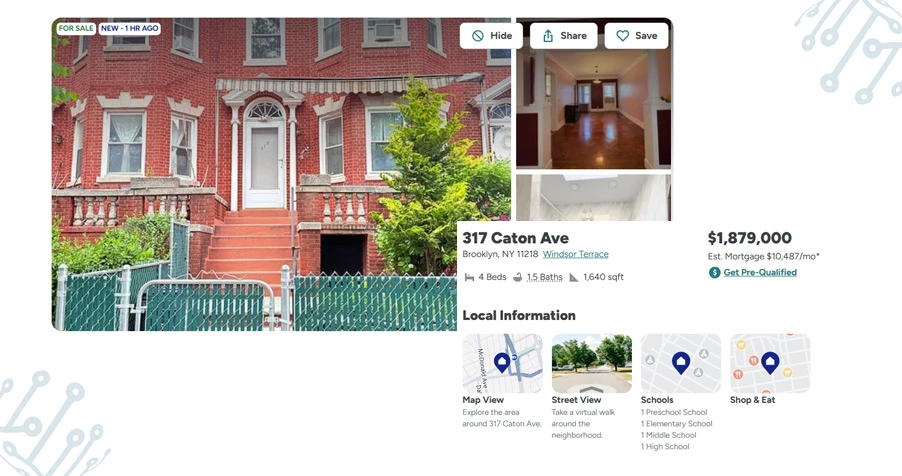
Property values across major metropolitan areas can change quickly because of interest rates, available inventory, buyer demand, seasonal activity, and nearby development projects. Investors, brokers, and agencies need updated pricing information to determine whether a listing is fairly positioned against comparable properties.
Organizations can integrate Web Scraping API Services into reporting workflows to receive structured listing records through scheduled feeds or connected systems. This approach reduces repetitive research work and supports dashboards that compare prices by locality, property type, budget range, and availability.
Automated collection allows teams to record original prices, revised prices, listing dates, status changes, and comparable property values from relevant sources. These records make it easier to identify price reductions, evaluate days on market, and understand whether sellers are adjusting expectations.
| Pricing Indicator | Data Point | Decision Support |
|---|---|---|
| Price movement | Original and revised listing price | Detects reductions and market adjustments |
| Comparable value | Similar property prices nearby | Supports valuation analysis |
| Listing duration | Days on market | Highlights demand strength |
| Inventory level | Active and removed listings | Measures supply conditions |
When teams Scrape Property Price Monitoring for New York and California as part of their analysis, they can compare similar listings, identify market adjustments, and support more realistic pricing recommendations.
Supporting Investment Research Through Structured Listing Intelligence
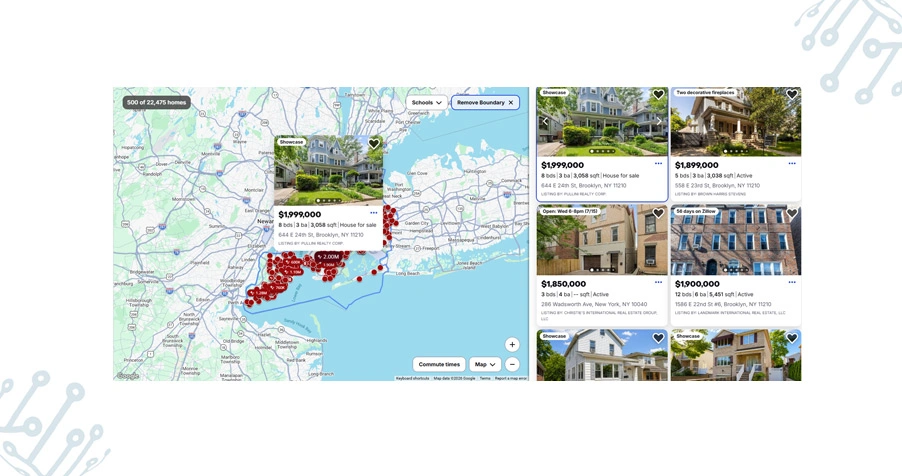
Investment planning requires more than reviewing a property’s current asking price. Buyers, developers, brokers, and research teams must assess location quality, available inventory, property condition, nearby amenities, market competition, and historical listing changes.
Structured listing information supports market reports, investment screening, neighborhood comparisons, and portfolio planning. Analysts can identify properties that match selected investment criteria while comparing local demand, listing availability, and pricing behavior.
Businesses can combine Real Estate Property Datasets with demographic indicators, local economic activity, development updates, and mapping information to create a broader market perspective. This combined view helps explain why certain neighborhoods experience rising demand, stronger rental activity, or changing property values.
| Research Area | Relevant Listing Data | Strategic Outcome |
|---|---|---|
| Investment screening | Price, size, location, property condition | Identifies suitable opportunities |
| Market demand analysis | Views, listing activity, availability | Measures buyer and tenant interest |
| Portfolio comparison | Property type, rental yield, market price | Improves asset allocation |
| Location intelligence | Schools, transport, nearby businesses | Supports neighborhood evaluation |
Teams can also assess New York Property Market Trends via Web Scraping to monitor listing activity, property features, and local changes that influence investment decisions. Organized market intelligence helps stakeholders compare opportunities accurately and build strategies around measurable property conditions.
How ArcTechnolabs Can Help You?
We help real estate businesses collect, organize, and analyze large volumes of property listing information from relevant online sources. With New York and California Property Listings Data Scraping integrated into your workflow, your team can access structured information for stronger pricing, rental, and investment decisions.
Our approach includes:
- Collect residential and commercial listing details from selected sources
- Monitor active, sold, rented, and removed property listings
- Track pricing changes and comparable property values
- Receive customized datasets in preferred formats
- Integrate listing records with dashboards and internal systems
- Schedule automated data delivery based on business requirements
We also help businesses maintain clean, standardized, and actionable datasets for ongoing analysis. Through California Real Estate Data Extraction Services, organizations can evaluate market conditions, monitor competitive listings, and improve planning across high-value property markets.
Conclusion
Reliable property intelligence helps businesses evaluate listing activity, price movement, rental demand, and investment opportunities with greater confidence. By applying New York and California Property Listings Data Scraping, real estate professionals can turn scattered online records into useful insights that support faster market research and better property decisions.
Our Real Estate App Data Scraping for Property Market Analysis approach supports accurate reporting, scalable monitoring, and practical market evaluation. Contact ArcTechnolabs today to build a customized property data solution for your real estate goals.