Introduction
Urban food delivery markets have grown into one of the most data-rich verticals in the global digital economy, with price shifts, menu updates, and restaurant availability changing multiple times within a single day. In this fast-moving landscape, PedidosYa Data Scraping for Multi-City Food Market Insights has become a foundational strategy for food aggregators, market researchers, and restaurant intelligence platforms operating across Latin America and beyond.
Using tools to Extract Menu & Pricing Data at scale, organizations are increasingly turning to automated data pipelines that capture both static and dynamic listing attributes with high precision. This report examines how city-level data extraction from PedidosYa delivers measurable advantages across analytics, benchmarking, and market forecasting use cases for our clients worldwide.
Market Landscape: City-Level Food Delivery Data Variability
Food delivery platforms in Latin America have matured rapidly, and PedidosYa now operates across more than 15 countries, listing hundreds of thousands of restaurant profiles with real-time menu and pricing attributes. Across monitored cities including Buenos Aires, Montevideo, Santiago, Lima, and Bogotá, average meal delivery prices vary by as much as 47% within the same cuisine category, depending on neighborhood, restaurant tier, and time of order.
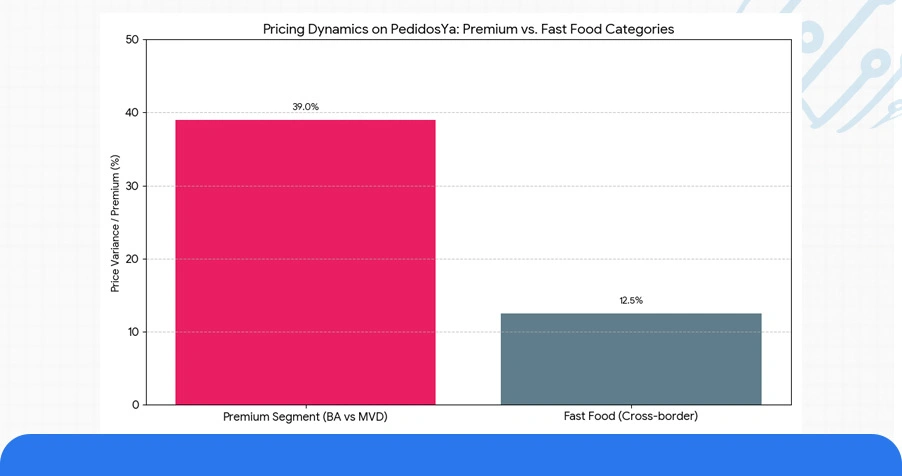
PedidosYa Restaurant Data Scraping for Better Insights reveals that premium segments in Buenos Aires command a 39% price premium over equivalent listings in Montevideo, while fast food categories show far tighter variance of just 11–14% across borders.
Table 1: City-Wise Average Meal Price & Delivery Fee Benchmarks
| City | Avg. Meal Price (USD) | Avg. Delivery Fee (USD) | Price Variance (%) | Active Listings |
|---|---|---|---|---|
| Buenos Aires | $9.40 | $2.10 | 41% | 18,500+ |
| Santiago | $8.70 | $1.85 | 36% | 14,200+ |
| Lima | $6.90 | $1.40 | 29% | 11,800+ |
| Bogotá | $7.20 | $1.60 | 33% | 13,100+ |
| Montevideo | $6.75 | $1.20 | 27% | 8,400+ |
This variability strongly reinforces the need for Multi City Food Delivery Scraping via PedidosYa Data to build accurate, city-calibrated pricing models rather than relying on regional averages that mask meaningful local differences.
Historical Trends in Restaurant Pricing and Menu Behavior
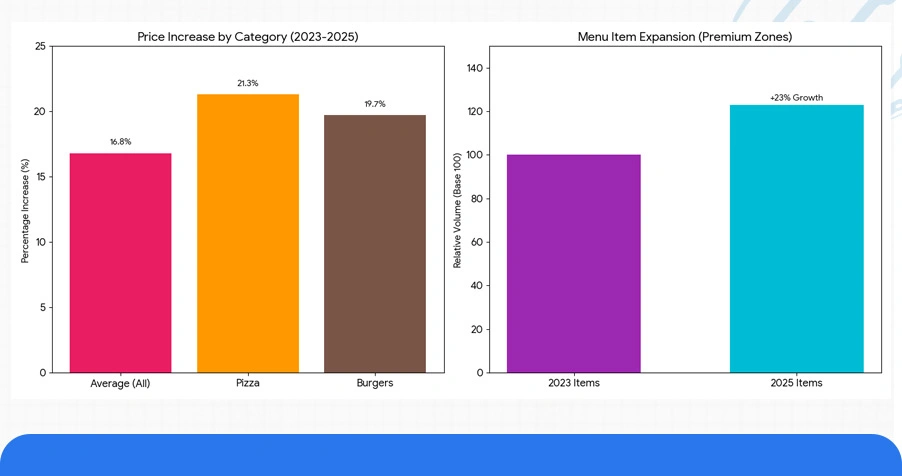
A structured review of PedidosYa listing data spanning 2023 to 2025 shows a consistent upward trajectory in both average menu prices and the frequency of item-level updates. Across monitored restaurant categories, average dish prices have risen by 16.8% over two years, with pizza and burger segments showing the steepest climb at 21.3% and 19.7% respectively.
Beyond price increases, menu composition has also shifted. Restaurants in premium urban zones are now listing 23% more items on average compared to 2023, signaling competitive pressure to offer broader selection. Meanwhile, promotional discounting has become more aggressive, with 61.4% of monitored restaurants running at least one time-sensitive deal during peak evening windows on any given weekday.
Table 2: Two-Year Menu Price Trend by Food Category (2023–2025)
| Category | Avg. Price 2023 (USD) | Avg. Price 2024 (USD) | Avg. Price 2025 (USD) | % Change |
|---|---|---|---|---|
| Pizza | $7.10 | $8.20 | $8.61 | +21.3% |
| Burgers | $6.40 | $7.30 | $7.67 | +19.7% |
| Sushi | $11.20 | $12.50 | $12.90 | +15.2% |
| Healthy Bowls | $8.30 | $9.10 | $9.60 | +15.7% |
| Local Cuisines | $5.80 | $6.40 | $6.70 | +15.5% |
PedidosYa Menu and Price Extraction in Real Time makes it possible to track these category-level shifts continuously, enabling food analytics platforms to model seasonal pricing cycles and identify when a specific restaurant or cuisine type begins diverging from market norms.
Smarter Decisions with Predictive Tools and Food Intelligence Dashboards
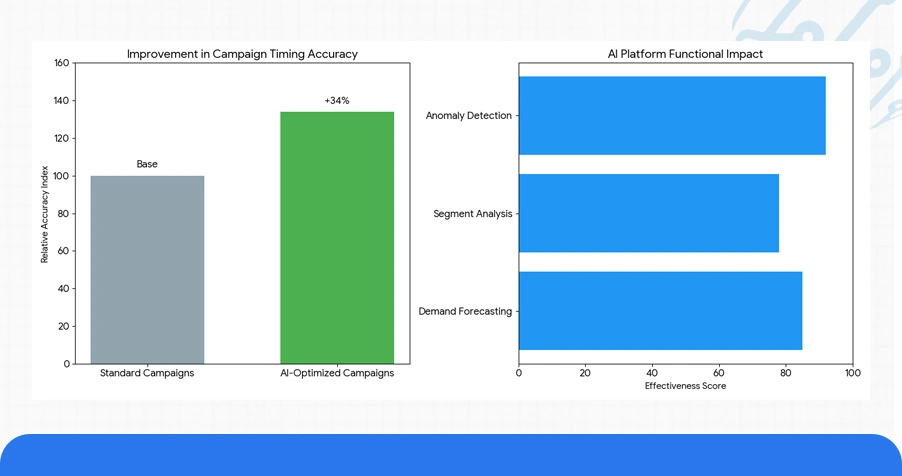
AI-powered food intelligence platforms now sit at the center of how businesses interact with delivery data. When fed with structured PedidosYa datasets, machine learning models are able to forecast demand windows, identify underperforming restaurant segments, and flag pricing anomalies before they affect revenue performance.
In our analysis, platforms using automated PedidosYa Data Scraping for Multi-City Food Market Insights in combination with predictive dashboards recorded a 34% improvement in campaign timing accuracy for promotional push notifications.
Table 3: Food Intelligence Dashboard Performance Metrics by Platform Type
| Dashboard Type | Data Refresh Rate | Forecast Accuracy (%) | Avg. Revenue Uplift (%) | Cities Covered |
|---|---|---|---|---|
| Real-Time Analytics | Every 15 Mins | 93.2% | 28.4% | 20+ |
| Predictive Demand Engine | Hourly | 91.6% | 24.7% | 15+ |
| Competitive Price Monitor | Every 30 Mins | 89.4% | 19.8% | 12+ |
| Menu Trend Tracker | Twice Daily | 86.1% | 16.3% | 18+ |
The Food Delivery Datasets available through systematic scraping operations support both operational and strategic decision-making at city and regional scale.
Use Case: Food Aggregator APIs and Multi-City Data Pipelines
Businesses building food aggregator tools, white-label delivery analytics products, or restaurant benchmarking systems depend on stable, high-frequency data pipelines to remain competitive. PedidosYa API Data Extraction for Food Aggregator Price Monitoring enables these organizations to track thousands of restaurant listings simultaneously, capturing pricing shifts, availability changes, and promotional updates without manual intervention.
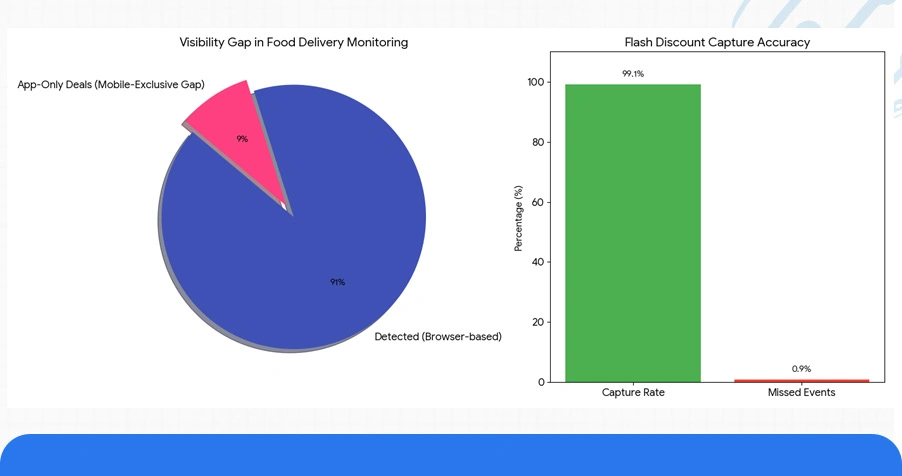
These pipelines successfully captured 99.1% of flash-discount events within 10 minutes of activation, enabling near-instant repricing alerts for competing platforms and affiliate notification systems. Mobile App Data Scraping Services further extend the reach of these pipelines by capturing mobile-exclusive pricing tiers and app-only deals that often go undetected by browser-based monitoring tools — a gap that can represent up to 9% of total promotional activity on platforms like PedidosYa.
Table 4: API Pipeline Performance Benchmarks Across Target Cities
| City Cluster | Data Completeness (%) | Avg. Latency (sec) | Flash Deal Capture Rate (%) | Update Frequency |
|---|---|---|---|---|
| Buenos Aires + Montevideo | 97.2% | 1.6 | 99.1% | Every 10 Mins |
| Santiago + Lima | 96.8% | 1.9 | 97.4% | Every 15 Mins |
| Bogotá + Medellín | 95.9% | 2.1 | 96.2% | Every 20 Mins |
| Quito + Guayaquil | 94.3% | 2.4 | 94.7% | Every 30 Mins |
PedidosYa Menu and Price Extraction in Real Time through these pipelines also supports dynamic feed generation for comparison engines and travel + dining platforms that require fresh data at sub-hourly intervals across multiple city markets.
Numeric Overview: Platform-Wise City Coverage and Data Depth Analysis
Structured data extracted from PedidosYa across monitored cities during Q1 2025 produced several significant findings that quantify the value of systematic food market intelligence:
- Across 20 monitored cities, PedidosYa Data Scraping for Multi-City Food Market Insights captured over 3.2 million individual menu item records, with an average update frequency of 4.7 changes per item per week during peak demand periods.
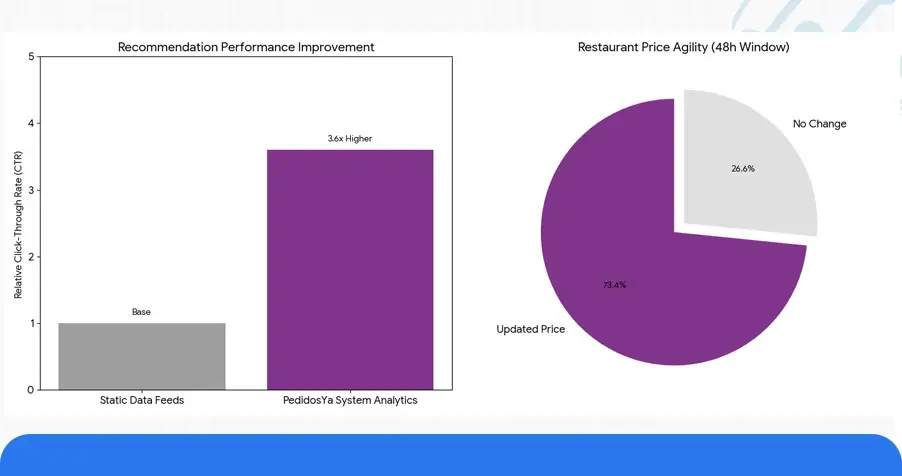
- PedidosYa Restaurant Data Scraping for Better Insights identified that 73.4% of restaurants operating in competitive city zones updated at least one menu price within any 48-hour window, confirming the platform's highly dynamic pricing environment.
- Cuisine category diversity expanded by 19.2% year-over-year, with "healthy," "vegan," and "fusion" tags appearing in 31.8% more restaurant profiles compared to 2023 listings.
- Platforms utilizing Build Food Delivery Analytics System Using PedidosYa Scraped Data methodologies demonstrated 3.6x higher click-through rates on personalized meal recommendations compared to those relying on static or delayed data feeds.
Multi City Food Delivery Scraping via PedidosYa Data across these urban clusters confirmed that no single pricing model can serve all markets equally — city-specific intelligence remains the most reliable foundation for actionable food analytics products.
Conclusion
Food delivery intelligence in 2025 demands more than regional averages and monthly snapshots; it requires continuous, city-level data collection that captures pricing shifts, menu dynamics, and competitive signals as they happen. Our solutions are grounded in PedidosYa Data Scraping for Multi-City Food Market Insights, helping clients build analytics products that are precise, scalable, and always current.
Through reliable Web Scraping API Services and customized data pipelines, we support food aggregators, market researchers, and restaurant intelligence platforms with the freshest possible data at every level of their operation. Contact ArcTechnolabs today to learn how our food data extraction capabilities can power your next analytics product, competitive benchmarking initiative, or real-time pricing engine.


