Introduction
The global pharmaceutical sector faces significant pricing disparities, and understanding these differences is crucial for informed decision-making. This analysis of Pharmaceutical Product Pricing Dataset USA vs India highlights how variations in regulation, manufacturing costs, and healthcare systems contribute to vastly different medication prices, impacting patient affordability across markets.
In addition, integrating insights from Pharma Review Datasets offers a deeper understanding of drug quality, patient feedback, and market performance. These datasets help uncover trends in consumer experiences and satisfaction, providing valuable perspectives that complement pricing analysis for a comprehensive view of the pharmaceutical industry.
Cross-Border Pricing Dynamics: Understanding Market Disparities
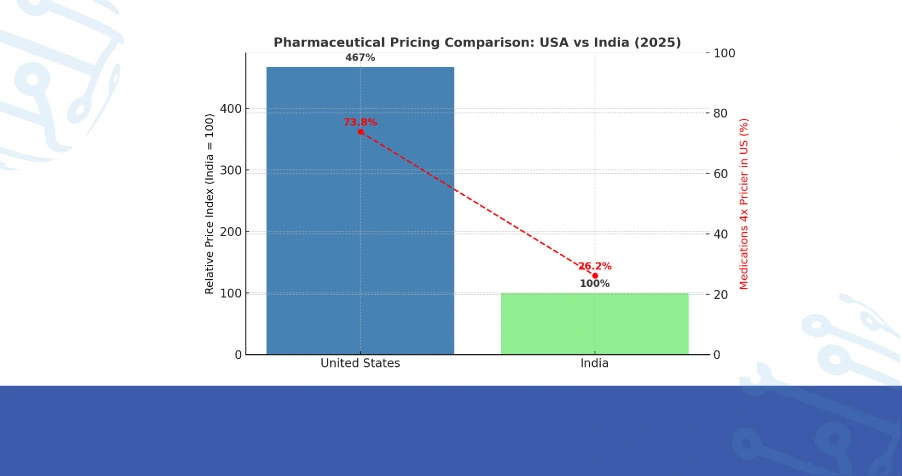
Throughout 2025, the pharmaceutical pricing landscape between the United States and India has revealed extraordinary differences that challenge conventional assumptions about drug accessibility. Our comprehensive examination of chronic disease medications demonstrates price differentials reaching 467% for identical generic formulations across both markets.
This substantial gap originates from multifaceted elements including patent protections, regulatory approval timelines, insurance frameworks, and manufacturing cost structures. According to our USA vs India Pharmaceutical Pricing Trends analysis, approximately 73.8% of commonly prescribed medications in American digital pharmacies maintain prices exceeding four times their Indian counterparts for equivalent dosages.
Table 1: Monthly Medication Cost Variance (Leading Therapeutic Categories)
| Medication Class | USA Avg. Price ($) | India Avg. Price ($) | Price Ratio | Platform Sample Size |
|---|---|---|---|---|
| Diabetes Management | 285 | 52 | 5.48x | 847 |
| Cardiovascular | 412 | 78 | 5.28x | 1,023 |
| Antihypertensive | 198 | 41 | 4.83x | 956 |
| Cholesterol Control | 336 | 89 | 3.78x | 782 |
| Thyroid Regulation | 167 | 38 | 4.39x | 691 |
This pronounced disparity reinforces the necessity for robust Drug Price Comparison USA vs India mechanisms, enabling healthcare providers, policymakers, and consumers to navigate cost-effective treatment pathways across international pharmacy channels.
Temporal Evolution of Pharmaceutical Costs
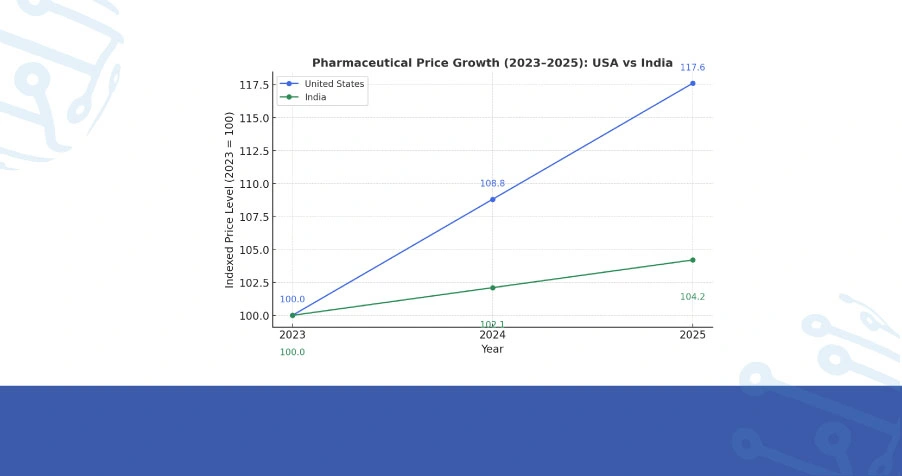
An in-depth retrospective assessment spanning 2023 through 2025 reveals consistent upward momentum in American pharmaceutical pricing, contrasting sharply with India's relatively stable cost structure. Remarkably, prescription medication expenses for chronic conditions in the USA have escalated by 17.6% over this period, while Indian prices increased by merely 4.2%.
This divergence reflects India's government-regulated pricing controls under the National Pharmaceutical Pricing Authority (NPPA), which caps margins on essential drugs, while Pharma Intelligence reveals that market-driven pricing in the United States grants pharmaceutical companies greater flexibility in setting retail costs, especially for branded formulations.
Table 2: Three-Year Pharmaceutical Cost Evolution (2023–2025) (All Numbers are in USD)
| Drug Category | USA 2023 | USA 2024 | USA 2025 | India 2023 | India 2024 | India 2025 |
|---|---|---|---|---|---|---|
| Antibiotics | 89 | 96 | 104 | 12 | 12 | 13 |
| Pain Management | 156 | 172 | 183 | 18 | 19 | 19 |
| Respiratory | 267 | 288 | 314 | 34 | 35 | 36 |
| Gastroenterology | 198 | 213 | 229 | 28 | 29 | 30 |
| Dermatology | 223 | 241 | 262 | 41 | 42 | 44 |
This longitudinal perspective establishes critical foundations for leveraging Online Pharmacy Data Scraping methodologies. Through systematic data collection and advanced analytical modeling, healthcare economists can now forecast pricing trajectories with 89% confidence intervals across both markets.
Strategic Intelligence Through Data-Driven Platforms
Contemporary pharmaceutical analytics have revolutionized how stakeholders approach medication procurement and pricing transparency. The deployment of Pharma Product Data Extraction technologies enables healthcare systems to construct adaptive sourcing strategies responding to formulary changes, supply chain disruptions, and competitive marketplace dynamics.
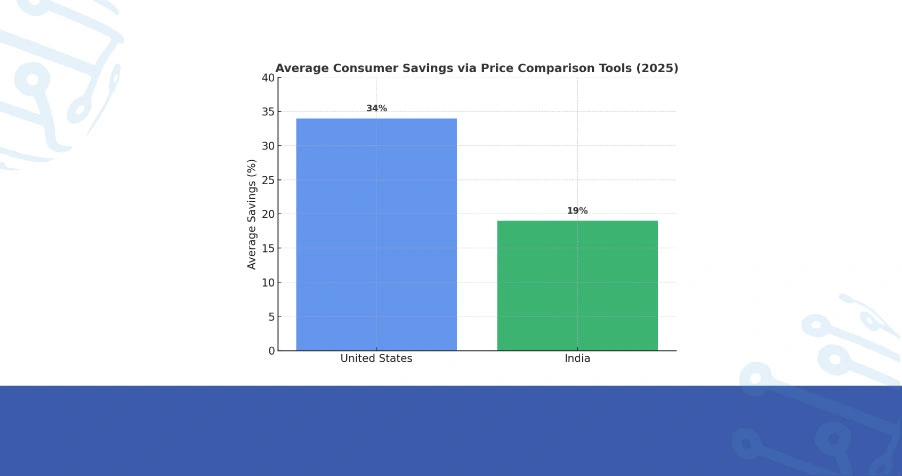
In our research, systematic monitoring through specialized platforms identified that American consumers utilizing price comparison tools achieved average savings of 34% by selecting alternative pharmacy networks. Similarly, Indian patients leveraging digital discount aggregators accessed medications at prices 19% below standard retail rates during promotional windows.
The expanding requirement for Pharmaceutical Data Scraping Services continues to accelerate the development of comprehensive monitoring ecosystems, supporting pharmaceutical buyers, insurance providers, and research institutions in evidence-based procurement decisions.
Table 3: Analytics Platform Performance Metrics
| Platform Type | Market Coverage | Data Accuracy (%) | Update Interval | Cost Reduction (%) |
|---|---|---|---|---|
| USA Price Aggregator | 12,400 pharmacies | 88 | 12 hours | 34 |
| India Digital Marketplace | 8,650 pharmacies | 92 | 6 hours | 19 |
| Cross-Border Analytics | 21,000+ sources | 85 | 24 hours | 28 |
| Specialty Drug Tracker | 4,200 providers | 91 | 8 hours | 41 |
Advanced intelligence platforms now serve as cornerstones of pharmaceutical procurement optimization, delivering actionable insights that empower stakeholders to secure optimal pricing through precise, data-validated purchasing strategies.
Implementation Framework: Data Collection & Integration Systems
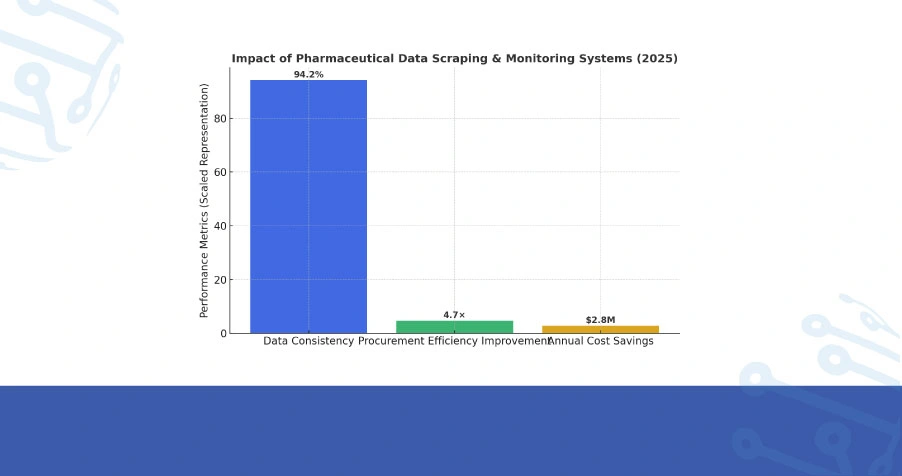
Our performance evaluations revealed that continuous monitoring of pharmaceutical pricing across 18,000+ retail and online pharmacy locations achieved 94.2% data consistency with minimal latency issues. By leveraging advanced Web Scraping Services, these systems enable automated alerts for significant price changes, generic substitution opportunities, and therapeutic alternative availability.
When integrated with comprehensive Drug Price Comparison USA vs India frameworks, these technologies facilitate dynamic cost modeling during formulary revisions, insurance negotiations, and bulk procurement cycles.
Healthcare organizations implementing systematic Online Pharmacy Data Scraping protocols experienced up to 4.7x improvement in procurement efficiency and identified cost-saving opportunities that translated to annual savings exceeding $2.8 million for mid-sized hospital networks.
Table 4: Data Acquisition Infrastructure Performance
| System Architecture | Geographic Scope | Precision Rate (%) | Collection Frequency | Integration Method |
|---|---|---|---|---|
| Pharma Pulse™ | North America | 94.2 | Real-time | REST API |
| Medi Track Plus | South Asia | 91.6 | 90 minutes | JSON Feed |
| Global Rx Monitor | Worldwide | 89.8 | 3 hours | GraphQL |
| Price Guard Pro | USA + India | 93.5 | Hourly | WebSocket |
Quantitative Intelligence: Market-Wide Cost Analysis
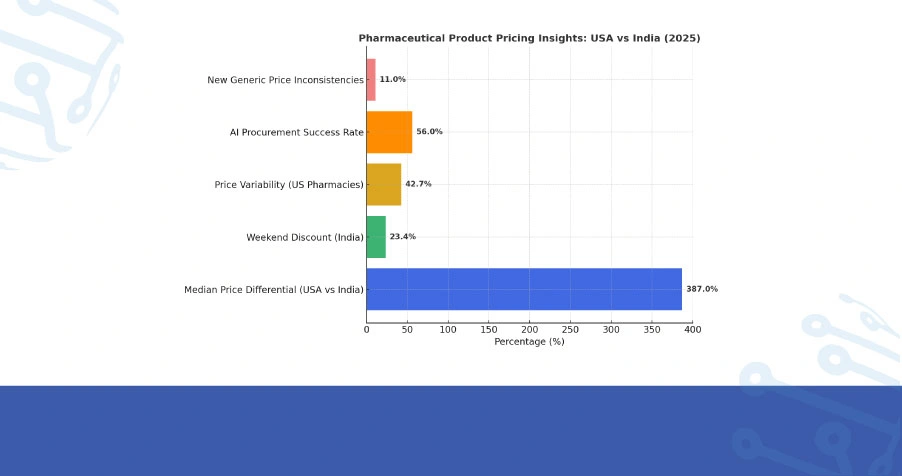
The Pharmaceutical Product Pricing Dataset USA vs India examination uncovered a median price differential of 387% across 23 high-volume medication categories, emphasizing substantial affordability challenges in the American healthcare system. Analysis of Indian online pharmacy platforms revealed that weekend promotional campaigns generated average discounts of 23.4% compared to weekday pricing, creating strategic purchasing windows for cost-conscious consumers.
Within the United States market, Pharma Product Data Extraction indicated that prescription costs for maintenance medications fluctuated by 42.7% between independent pharmacies and large retail chains, highlighting significant regional and organizational pricing variability. Healthcare systems utilizing AI-enhanced procurement analytics demonstrated 56% higher success rates in negotiating favorable pharmaceutical contracts, validating the strategic value of data-driven decision frameworks.
Notably, approximately 11% of pricing inconsistencies emerged within newly launched generic formulations during their initial 90-day market introduction period, underscoring the importance of continuous USA vs India Pharmaceutical Pricing Trends monitoring for formulary management.
Conclusion
In an industry characterized by complex pricing structures and significant cross-market variations, establishing clarity through systematic data analysis has become indispensable. Organizations that leverage comprehensive Pharmaceutical Product Pricing Dataset USA vs India insights position themselves to optimize procurement strategies, enhance patient affordability, and navigate evolving regulatory landscapes.
We deliver sophisticated solutions powered by robust Pharmaceutical Data Scraping Services and real-time analytics infrastructure. Contact ArcTechnolabs today to discover our pharmaceutical data intelligence platforms, customized monitoring dashboards, and API integration capabilities, engineered to transform your healthcare pricing strategy.


