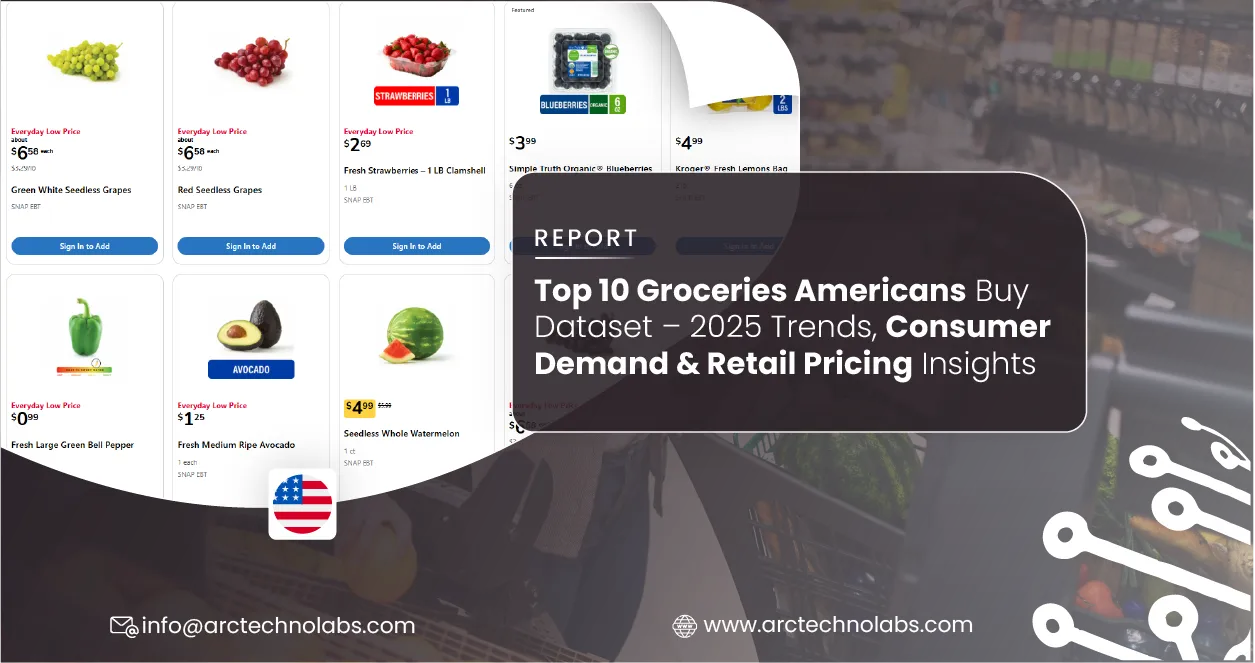
Introduction
Understanding what U.S. consumers buy most frequently provides critical insight for CPG brands, supermarkets, online retailers, and delivery platforms. The Top 10 Groceries Americans Buy Dataset offers a real-time window into evolving preferences, price sensitivity, and demand elasticity.
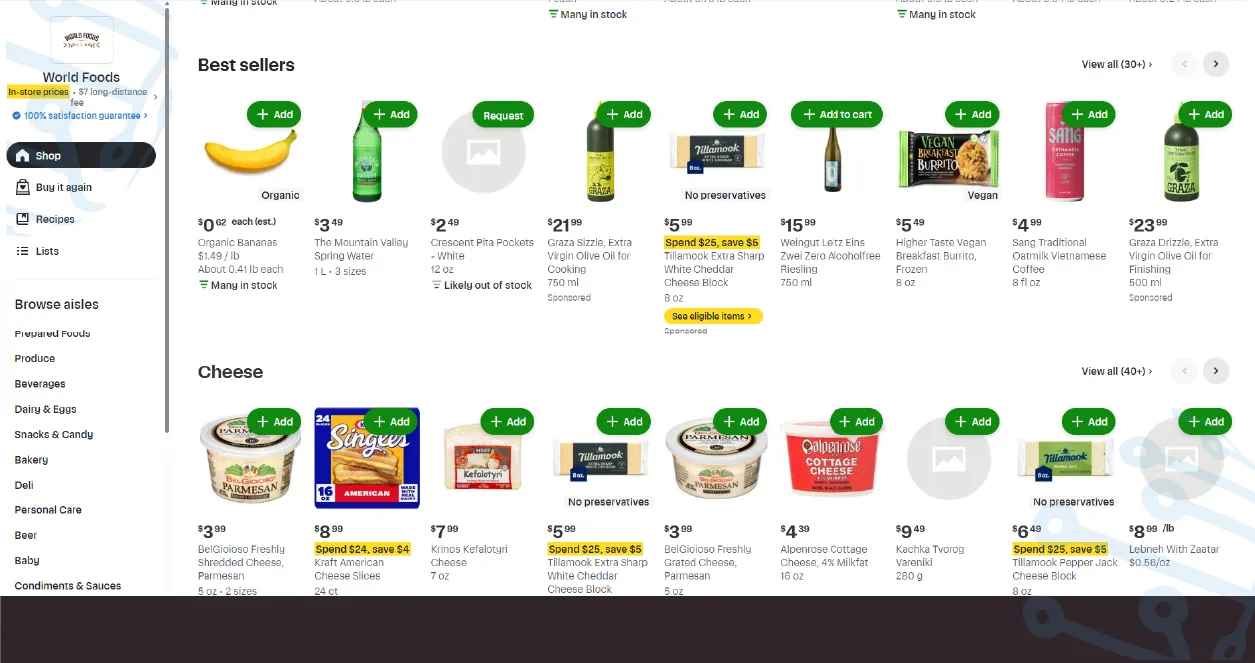
As consumer behavior has shifted from in-store to online grocery shopping, the importance of structured, clean datasets has grown. Whether businesses are looking to Scrape Most Purchased Grocery Items in the USA or analyze long-term sales patterns, data is the foundation for smarter merchandising and marketing.
This research report explores how grocery sales data scraping enables brands and platforms to make informed decisions, track high-demand SKUs, and respond swiftly to retail trends.
Why Grocery Data Matters More Than Ever?
Grocery inflation, urbanization, and digital adoption are reshaping U.S. household spending. By leveraging the Top 10 Groceries Americans Buy Dataset, stakeholders can:
- Identify the most consistently purchased items
- Track product pricing fluctuations in real-time
- Understand regional buying trends and preferences
- React faster to stockouts or new product launches
With the ability to Extract Grocery Sales Data for U.S. Consumers, businesses gain valuable market intelligence that influences stocking, promotions, and category development.
Core Grocery Categories in Focus (2020–2025)
| Year | Fresh Produce | Dairy | Packaged Snacks | Beverages | Bread & Bakery |
|---|---|---|---|---|---|
| 2020 | $23.1B | $18.2B | $16.0B | $19.5B | $12.1B |
| 2021 | $24.8B | $19.0B | $17.6B | $20.9B | $13.0B |
| 2022 | $26.3B | $20.5B | $19.4B | $22.3B | $14.2B |
| 2023 | $28.1B | $21.9B | $20.6B | $23.8B | $15.0B |
| 2024 | $30.0B | $22.5B | $21.8B | $25.2B | $16.3B |
| 2025 | $32.4B | $23.9B | $22.7B | $26.5B | $17.5B |
Analysis: Fresh produce and dairy remain essential weekly staples, while snacks and beverages show strong year-over-year growth due to convenience-driven consumption.
Top 10 Grocery Items Bought in the U.S. (2025)
| Rank | Grocery Item | Avg. Monthly Sales (Units) | Price Range ($) |
|---|---|---|---|
| 1 | Bananas | 48M | 0.59–0.79 |
| 2 | Whole Milk | 44M | 3.49–4.79 |
| 3 | White Bread Loaf | 40M | 2.99–4.50 |
| 4 | Bottled Water (1L) | 38M | 0.99–1.49 |
| 5 | Eggs (Dozen) | 35M | 3.29–4.99 |
| 6 | Apples (Red/Green) | 33M | 1.99–3.99/lb |
| 7 | Chicken Breast | 30M | 3.99–7.99/lb |
| 8 | Cheddar Cheese | 28M | 2.99–5.99 |
| 9 | Frozen Pizza | 26M | 4.49–8.99 |
| 10 | Packaged Cereal | 25M | 3.49–6.99 |
Analysis: Perishables like bananas and milk continue to dominate, while frozen and shelf-stable products reflect the rise in time-saving meal options.
Data Extraction & Use Cases
Using Extract Frequently Bought Grocery Items in America, platforms and suppliers gain:
- Inventory forecasting capabilities
- Predictive insights for product launches
- Regional demand comparisons
The Grocery Retail Intelligence Dataset helps retailers benchmark performance and identify whitespace in both online and offline channels. With access to a High-Demand Grocery Product Dataset USA, suppliers can proactively engage in supply chain planning.
Shopping Habits & Pricing Trends
Using an American Grocery Shopping Habits Dataset, we observed:
| Behavior Metric | 2020 | 2021 | 2022 | 2023 | 2024 | 2025 |
|---|---|---|---|---|---|---|
| Online Orders (%) | 27% | 34% | 41% | 48% | 52% | 58% |
| Avg Basket Value ($) | 55 | 59 | 63 | 66 | 71 | 75 |
| Coupon Usage (%) | 32% | 29% | 27% | 24% | 22% | 19% |
Analysis: Online grocery shopping is steadily rising, with a decline in coupon dependency due to subscription models and loyalty rewards.
Technology Powering Grocery Data Extraction
Advanced tools are being used to Scrape Top-Selling Grocery Products USA and perform Web Scraping Grocery Prices:
| Tool/Service | Function |
|---|---|
| Web Scraping API Services | Real-time pricing and stock tracking |
| Grocery & Supermarket Datasets | Structured, categorized product data |
| Mobile App Scraping Services | Extract prices and offers from native apps |
| Web Scraping Servicesicon | Full-stack scraping infrastructure and maintenance |
With these, ArcTechnolabs helps retailers, eCommerce platforms, and suppliers tap into the pulse of grocery retail.
Conclusion
In 2025, staying ahead in grocery retail requires access to the right data. The Top 10 Groceries Americans Buy Dataset enables businesses to understand consumer preferences, price trends, and demand fluctuations in real time. From planning promotions to stocking shelves, the insights are practical and actionable.
Ready to extract actionable grocery insights? Contact ArcTechnolabs for custom grocery data scraping solutions tailored to your retail intelligence needs!


