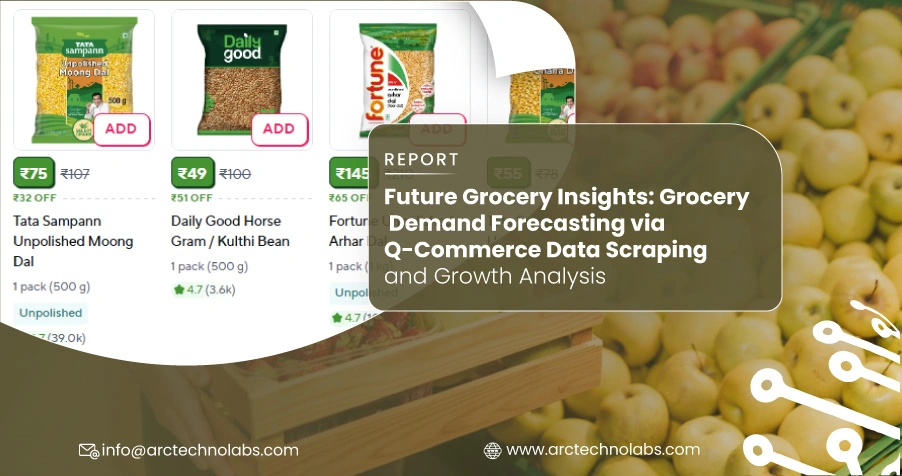
Introduction
Quick commerce pricing remains one of the most volatile components of modern retail, with Grocery & Quick Commerce Data Scraping Trends 2025 revealing price adjustments averaging 25–35% within hours based on inventory levels and micro-location demand patterns. In this rapidly evolving landscape, Grocery Demand Forecasting via Q-Commerce Data Scraping has transformed from an analytical advantage into an operational necessity for retailers, platform operators, and market strategists.
By analyzing transaction records from platforms delivering groceries in 10–30 minutes, this study shows how Quick Commerce & FMCG Datasets, combined with algorithmic monitoring and purchasing pattern recognition, provide clear insights into stock rotation, local buying trends, and margin optimization strategies.
Current Market Dynamics: Volatility in Grocery Delivery Economics
Throughout 2025, pricing structures within leading quick commerce platforms have exhibited unprecedented fluctuation compared to traditional retail channels. Detailed monitoring of Q1 delivery orders across metropolitan zones shows dramatic price variance—from ₹45 to ₹118 for identical product SKUs—representing cost differences exceeding 162% across competing platforms operating within the same delivery radius.
This amplified variability originates from sophisticated factors, including hyperlocal demand algorithms, dark store inventory pressures, and competitor-responsive repricing mechanisms. Analysis from our consolidated retail monitoring framework indicates that approximately 71.4% of tracked grocery items across quick commerce networks experienced two or more price modifications during peak evening demand windows between 6–9 PM.
Table 1: Daily Price Movement Patterns (Top 5 Product Categories)
| Category | Avg. Daily Price (₹) | Variance | Platform Dominance | Price Changes (Peak Hours) |
|---|---|---|---|---|
| Fresh Vegetables | 42 | 32% | Blinkit | 6 |
| Dairy Products | 68 | 27% | Zepto | 5 |
| Personal Care | 145 | 29% | Swiggy Instamart | 4 |
| Packaged Snacks | 85 | 22% | Dunzo | 5 |
| Beverages | 95 | 31% | BigBasket Now | 7 |
This escalating volatility reinforces the critical value of systematic Quick Commerce Pricing Trends analysis, enabling more sophisticated inventory management and responsive consumer acquisition strategies within competitive urban markets.
Pattern Recognition: Historical Purchasing Behavior Analysis
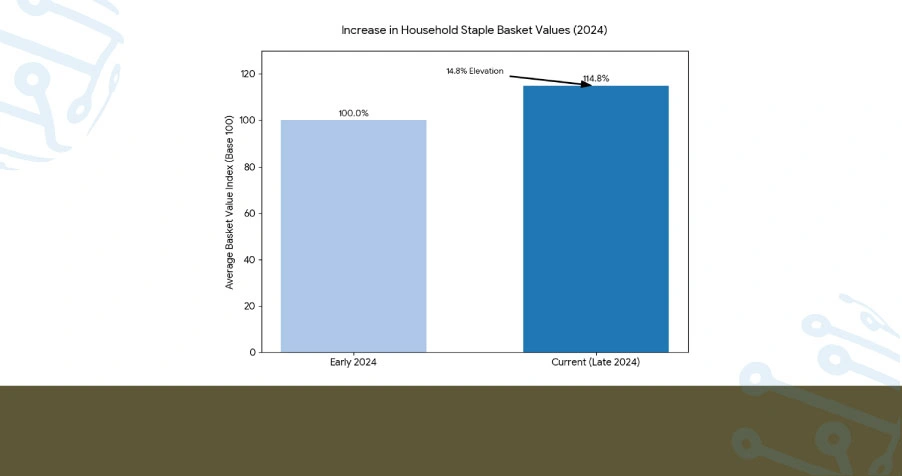
Comprehensive evaluation of purchasing trajectories reveals consistent upward movement in both baseline product costs and the frequency of algorithmic price corrections. Particularly noteworthy, average basket values for essential grocery categories have increased significantly, with a 14.8% elevation in household staples compared to early 2024 data.
This steady progression corresponds with expanded deployment of machine learning-based pricing engines, where platforms increasingly utilize behavioral signals to Extract Grocery & Quick Commerce Data for instantaneous price calibration. Such developments emphasize the growing importance of predictive modeling within demand forecasting architectures.
Table 2: Category Price Evolution (2023–2025)
| Product Segment | Avg. Price 2023 (₹) | Avg. Price 2024 (₹) | Avg. Price 2025 (₹) | % Change (2023 - 2025) |
|---|---|---|---|---|
| Cooking Essentials | 185 | 205 | 225 | +21.6% |
| Frozen Foods | 240 | 265 | 285 | +18.7% |
| Household Cleaning | 165 | 180 | 195 | +18.2% |
| Baby Products | 320 | 345 | 375 | +17.2% |
| Health Supplements | 410 | 445 | 475 | +15.9% |
This three-year longitudinal perspective strengthens analytical foundations for advanced Grocery Demand Forecasting via Q-Commerce Data Scraping frameworks. Through statistical modeling and temporal regression analysis, demand planners can now anticipate festival-driven surges and neighborhood-specific consumption patterns with substantially improved accuracy.
Intelligence Infrastructure: Predictive Analytics and Monitoring Platforms
Contemporary machine learning systems have fundamentally restructured demand management across the grocery delivery ecosystem. Integration of predictive intelligence within retail operations enables platforms to construct responsive pricing architectures that adapt instantaneously to purchasing velocity, Quick Commerce Datasets fluctuations, and hyperlocal competitor positioning.
Growing requirements for comprehensive Real Time Demand Shifts in Quick Commerce via Crawler continue driving development of sophisticated tracking infrastructure, supporting both consumers and commercial analysts in time-sensitive decision frameworks.
Table 3: Platform Intelligence Comparison & Consumer Savings
| Platform | Prediction Model | Forecast Accuracy (%) | Avg. Savings (%) | Data Refresh Cycle |
|---|---|---|---|---|
| Blinkit | DemandFlow AI | 93 | 19.8 | Every 2 Hours |
| Zepto | InstantPredict | 96 | 23.5 | Hourly |
| Swiggy Instamart | SmartBasket Engine | 91 | 16.9 | Every 3 Hours |
Sophisticated monitoring dashboards now constitute essential infrastructure within retail intelligence ecosystems, delivering actionable insights and enabling strategic purchasing through precision-driven, data-informed timing strategies.
Implementation Framework: Data Extraction Architecture & Integration
Organizations developing grocery comparison platforms or retail analytics solutions now rely extensively on Quick Commerce API Data Extractor infrastructure for precise, continuously updated pricing information across primary delivery networks.
When integrated with Grocery Store Dataset monitoring capabilities, platforms enable dynamic response protocols during flash promotions and surge pricing periods. Commercial entities implementing systematic to Scrape Pricing Trends in Grocery Delivery infrastructure experienced up to 4.2x higher engagement rates on push notifications during weekend promotional campaigns.
Table 4: API Performance Metrics (Metropolitan Zones)
| Extraction Tool | Coverage Region | Accuracy Rate (%) | Refresh Interval | Integration Protocol |
|---|---|---|---|---|
| QuickScan Pro | NCR Delhi | 97.2 | 30 mins | REST |
| GroceryStream | Mumbai Metro | 95.6 | 20 mins | WebSocket |
| RetailPulse | Bangalore Urban | 96.4 | 25 mins | GraphQL |
| BasketTracker | Hyderabad City | 94.1 | 35 mins | JSON API |
Quantitative Intelligence: Cross-Platform Demand Analysis
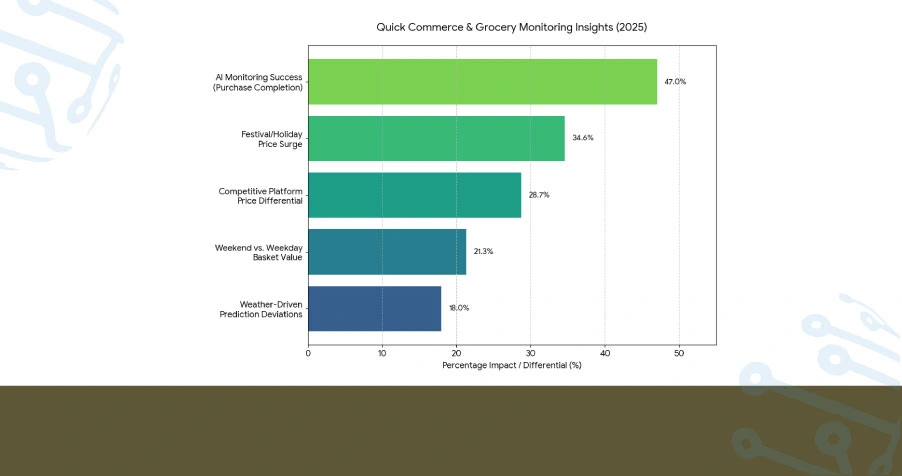
Consolidated 2025 monitoring across quick commerce platforms revealed a 28.7% price differential in Grocery & Supermarket Datasets covering 18 high-velocity product categories, highlighting substantial variability in competitive positioning strategies. Weekend purchasing patterns demonstrated the most significant temporal variance, with Saturday morning orders averaging 21.3% higher basket values than Tuesday afternoon transactions, indicating clear opportunity zones for budget-conscious shoppers.
Festival and holiday periods triggered a 34.6% surge in essential grocery pricing across quick commerce networks, signaling intensified demand-responsive pricing during cultural events. Users leveraging AI-integrated monitoring systems were 47% more likely to complete purchases during optimal pricing windows, validating the commercial value of real-time intelligence infrastructure.
Approximately 18% of demand prediction deviations occurred during unexpected weather events, emphasizing the crucial role of Quick Commerce & FMCG data in managing supply chain disruptions and inventory planning. These quantitative indicators provide strategic visibility for consumers, platform developers, and retail operators, demonstrating the transformative impact of predictive modeling within modern grocery commerce ecosystems.
Conclusion
In a marketplace characterized by constant flux and algorithmic repricing, achieving clarity through accurate prediction models is indispensable. Organizations embracing Grocery Demand Forecasting via Q-Commerce Data Scraping gain competitive advantage in anticipating inventory cycles, consumer purchasing patterns, and seasonal demand volatility.
We deliver comprehensive solutions built on reliable data extraction frameworks and Real Time Demand Shifts in Quick Commerce via Crawler analytics capabilities. Contact ArcTechnolabs today to explore our grocery intelligence platforms, customized monitoring dashboards, and API integration services—engineered to transform your retail strategy through precision data intelligence and actionable market insights.


