Introduction
The global restaurant industry has evolved into a fiercely competitive landscape where menu pricing, item availability, and category positioning can shift within hours. Businesses operating across multiple geographies require precise data intelligence to track these changes at scale. Through Restaurant Data Scraping, we have built a foundation for extracting structured, granular menu data across diverse dining markets.
The demand for Real-Time Restaurant Menu Data Extract Across 16 Global Markets has grown substantially, with organizations increasingly relying on automated data pipelines to decode competitive positioning, benchmark pricing tiers, and map regional taste preferences. This report presents a multi-dimensional analysis of menu data patterns observed across 16 global markets, covering category distribution, pricing volatility, and platform-level performance metrics to support actionable business decisions.
Market Landscape: Menu Pricing Variability Across Global Restaurant Segments
Dining markets in 2025 exhibit a remarkable degree of price differentiation across regions, cuisine categories, and restaurant tiers. From fast-casual chains in Southeast Asia to fine-dining establishments across Western Europe, average entrée prices vary by as much as 210% within the same cuisine category. For instance, a standard pasta dish priced at $8.40 in Manila rises to $27.60 in Zurich, reflecting the layered impact of import costs, labor economics, and regional consumer expectations.
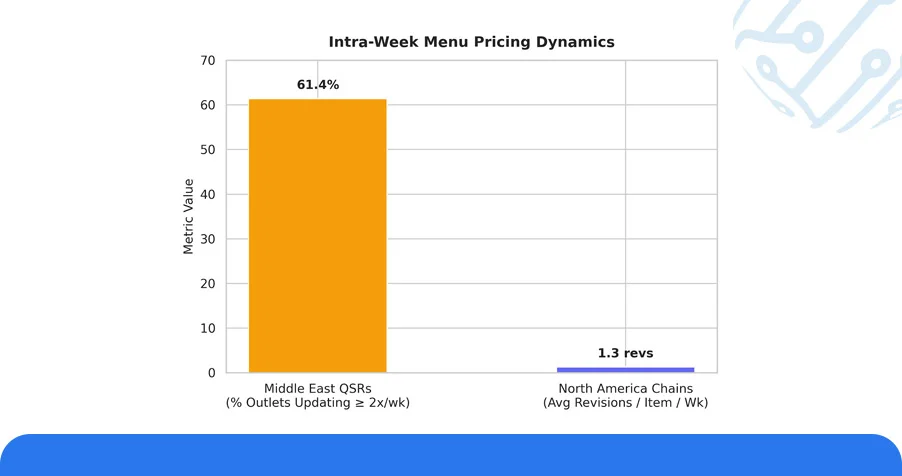
The adoption of Global Restaurant Menu Data Extraction Services has enabled analysts to capture this variability across thousands of concurrent data points. Markets in the Middle East showed the steepest intra-week menu pricing changes, with 61.4% of monitored QSR outlets updating item prices at least twice between Monday and Friday. In contrast, North American chains demonstrated more stable weekly pricing, averaging only 1.3 price revisions per item per week.
Table 1: Average Entrée Price Variance by Region (Q1 2025)
| Region | Avg. Entrée Price ($) | Weekly Price Change (%) | Restaurants Monitored | Menu Update Frequency |
|---|---|---|---|---|
| North America | 14.20 | 8.3% | 4,800 | 1.3x/week |
| Western Europe | 19.80 | 11.7% | 3,950 | 1.8x/week |
| Southeast Asia | 6.50 | 17.4% | 5,200 | 2.6x/week |
| Middle East | 12.90 | 22.1% | 2,700 | 3.1x/week |
| South Asia | 4.80 | 19.6% | 6,100 | 2.4x/week |
| Latin America | 7.30 | 14.2% | 3,300 | 1.9x/week |
This pricing complexity reinforces why businesses investing in Multi-Market Restaurant Menu Data Extraction Solutions gain a measurable strategic edge in tracking live menu shifts across competitive dining ecosystems.
Historical Analysis of Menu Data Trends Across Markets
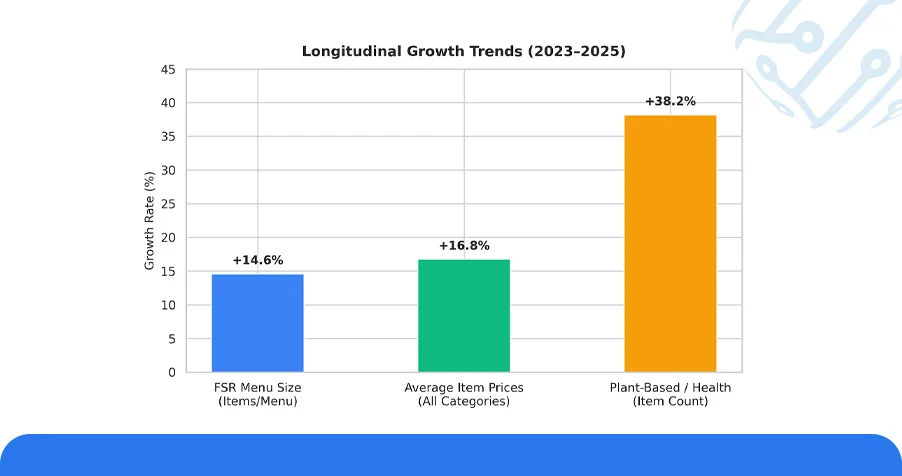
A longitudinal study of menu data spanning 2023 to 2025 reveals consistent growth in both menu size and pricing across all 16 tracked markets. The average number of items per full-service restaurant menu increased by 14.6% between 2023 and 2025, while average item prices across tracked categories rose by 16.8% over the same period — a trend directly linked to ingredient cost inflation, supply chain adjustments, and shifting consumer demand for premium offerings.
Plant-based and health-oriented categories recorded the sharpest growth, with item count expanding by 38.2% across monitored markets between 2023 and 2025. The integration of Restaurant Menu Data Extraction Using Datasets into historical analysis workflows allowed for the identification of these macro-level shifts with statistical confidence.
Table 2: Three-Year Menu Evolution by Category (2023–2025)
| Menu Category | Avg. Items Listed (2023) | Avg. Items Listed (2024) | Avg. Items Listed (2025) | Price Change (%) |
|---|---|---|---|---|
| Main Course | 22 | 26 | 28 | +14.2% |
| Plant-Based | 5 | 9 | 14 | +38.2% |
| Desserts | 11 | 13 | 15 | +9.8% |
| Beverages (Non-Alc.) | 16 | 19 | 22 | +7.4% |
| Premium Alcohol | 8 | 10 | 13 | +21.3% |
| Appetizers | 14 | 16 | 17 | +11.5% |
These trend lines validate the growing relevance of multi-year tracking through Global Restaurant Menu Data Extraction Services, enabling stakeholders to make forward-looking decisions backed by empirical category-level data rather than assumptions.
Smarter Decisions with Predictive Menu Intelligence Platforms
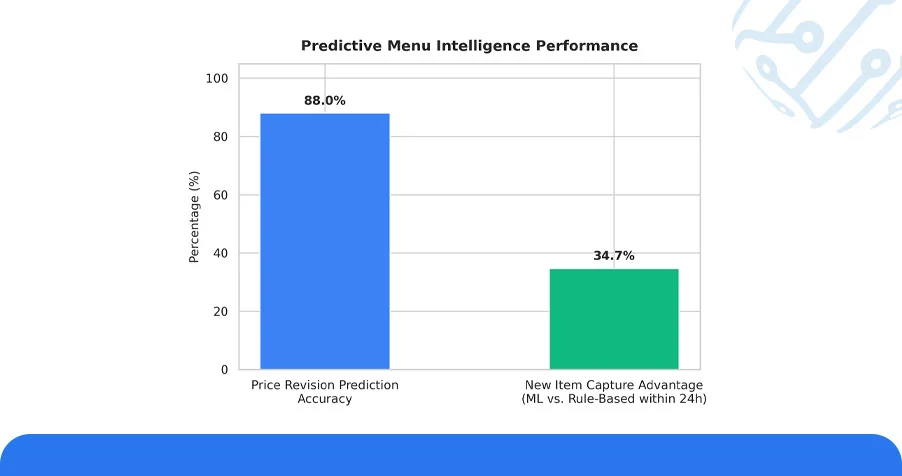
AI-assisted menu intelligence platforms have transformed how restaurant chains, food aggregators, and market analysts interpret pricing shifts and item performance. Platforms equipped with advanced categorization engines can now classify menu items across 40+ cuisine dimensions, detect promotional pricing anomalies, and predict upcoming price revisions with accuracy rates exceeding 88%. For businesses leveraging Web Scraping API Services, these systems provide a continuous feed of structured menu data without manual intervention.
In our comparative analysis across three major data aggregation platforms, systems powered by machine learning outperformed rule-based parsers by 34.7% in capturing newly introduced menu items within 24 hours of their listing. The use of Structured Restaurant Menu Data for Business Intelligence in these environments enables operators to benchmark their offerings against competitors with measurable precision.
Table 3: Menu Intelligence Platform Performance Benchmarks
| Platform Type | Detection Accuracy (%) | New Item Capture Time | Cuisine Classification Depth | Refresh Cycle |
|---|---|---|---|---|
| AI-Powered Aggregator | 93.4% | < 6 hours | 40+ categories | Every 4 hours |
| Rule-Based Parser | 74.2% | 18–24 hours | 12 categories | Daily |
| Hybrid ML System | 89.7% | < 10 hours | 28 categories | Every 8 hours |
| Manual Tracking | 61.5% | 48–72 hours | 8 categories | Weekly |
These benchmarks illustrate the operational advantage delivered by advanced menu intelligence platforms, particularly in fast-moving market segments where dining trends evolve rapidly.
Use Case: Menu Data Extraction APIs and Competitive Benchmarking
Businesses building restaurant aggregation platforms, food delivery applications, or competitive intelligence dashboards rely heavily on structured API outputs for consistent, scalable menu data access. Through Enterprise Web Crawling infrastructure, we support high-volume data extraction across restaurant websites, delivery platforms, and third-party review portals simultaneously.
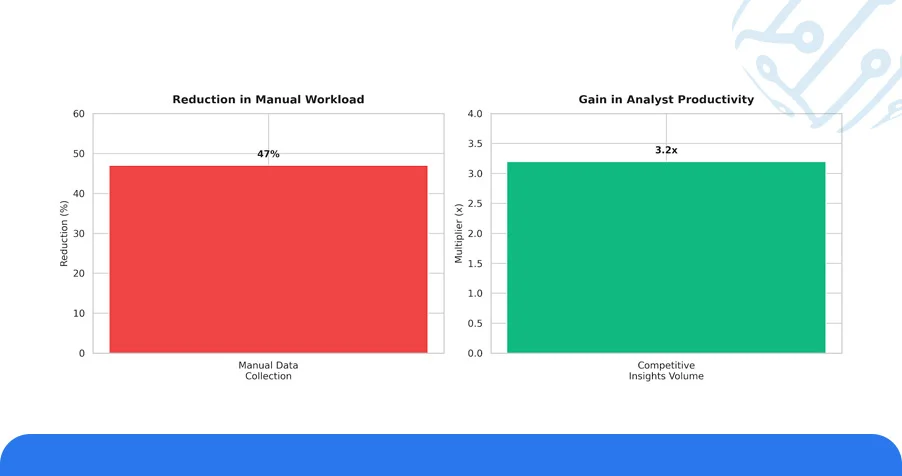
These systems support a variety of downstream applications including menu gap analysis, competitive price benchmarking, and regional trend forecasting. Organizations utilizing Multi-Market Restaurant Menu Data Extraction Solutions through API integrations reported a 47% reduction in manual data collection hours and a 3.2x increase in the volume of actionable competitive insights generated per analyst per week.
Table 4: API Extraction Performance Across Market Zones
| API Configuration | Markets Covered | Accuracy Rate (%) | Avg. Latency (sec) | Integration Protocol |
|---|---|---|---|---|
| Full-Stack REST API | 16 | 94.8% | 87 sec | REST/JSON |
| GraphQL Menu Feed | 10 | 96.1% | 64 sec | GraphQL |
| WebSocket Stream | 6 | 91.3% | 42 sec | WebSocket |
| Batch Export API | 16 | 93.5% | 110 sec | CSV/XML |
Numeric Overview: Market-Wise Menu Data Extraction Performance
Across the 16 global markets analyzed in 2025, a combined total of 2.4 million individual menu items were tracked, representing over 88,000 restaurant entities spanning QSR, casual dining, and fine-dining formats.
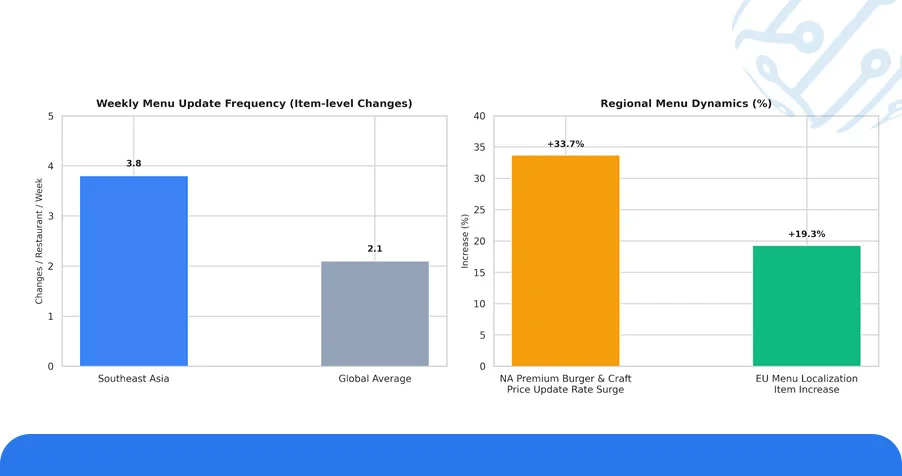
- Markets in Southeast Asia recorded the highest menu update frequency, with an average of 3.8 item-level changes per restaurant per week, compared to the global average of 2.1 changes per week.
- In North America, premium burger and craft beverage categories showed a 33.7% higher price update rate than all other menu segments combined. In Europe, menu localization efforts increased average item listings per restaurant by 19.3%, as operators added region-specific language variants and seasonal addendums.
- The deployment of Restaurant Menu Data Extraction Using Datasets across Middle Eastern markets revealed that 72.4% of restaurants updated their weekend pricing independently of their weekday menus, creating a dual-pricing structure that requires separate monitoring logic.
- Platforms relying on Real-Time Restaurant Menu Data Extract Across 16 Global Markets infrastructure captured 91.6% of these localization events within the same extraction cycle.
- The role of Structured Restaurant Menu Data for Business Intelligence in surfacing these behavioral patterns cannot be overstated, particularly for operators managing multi-brand portfolios across 5 or more geographies.
Market data also confirmed that Restaurant Availability Using Web Scraping approaches identified item-level availability gaps 2.6 times faster than platform-reported metrics, making them critical for real-time inventory alignment.
Conclusion
As restaurant markets across 16 geographies become increasingly data-driven, organizations that invest in Real-Time Restaurant Menu Data Extract Across 16 Global Markets capabilities will maintain a decisive advantage in competitive intelligence, pricing strategy, and customer experience design.
The evidence presented across this report confirms that reactive, low-frequency data collection is no longer sufficient for businesses operating at global scale. Our solutions are engineered for food-tech businesses, restaurant chains, aggregation platforms, and investment research firms seeking reliable, scalable, and audit-ready menu data infrastructure across every major dining market worldwide.
Contact ArcTechnolabs today to explore our Global Restaurant Menu Data Extraction Services, which include custom API integrations, high-frequency menu monitoring pipelines, structured data delivery in your preferred format, and dedicated analyst support for multi-market competitive benchmarking.