

Introduction
The food delivery industry in India has entered an era of relentless pricing competition, with restaurant margins tightening and consumer expectations rising every quarter. Platforms like Swiggy now host thousands of restaurant listings where menu prices, delivery fees, and promotional offers shift multiple times within a single day. In this environment, structured Swiggy Data Scraping Services have become foundational for businesses that need reliable, granular market intelligence rather than surface-level snapshots.
This report highlights how automated data extraction from Swiggy provides valuable insights into competitor activities, pricing trends, and market positioning. Using live datasets and platform metrics, Swiggy Data Extraction for Food Delivery Market Analysis supports informed decisions for restaurants, food aggregators, and analysts. The study covers menu price changes, delivery charges, platform comparisons, and the role of automated data pipelines in improving competitive strategies.
Market Landscape: Pricing Dynamics in India's Food Delivery Sector
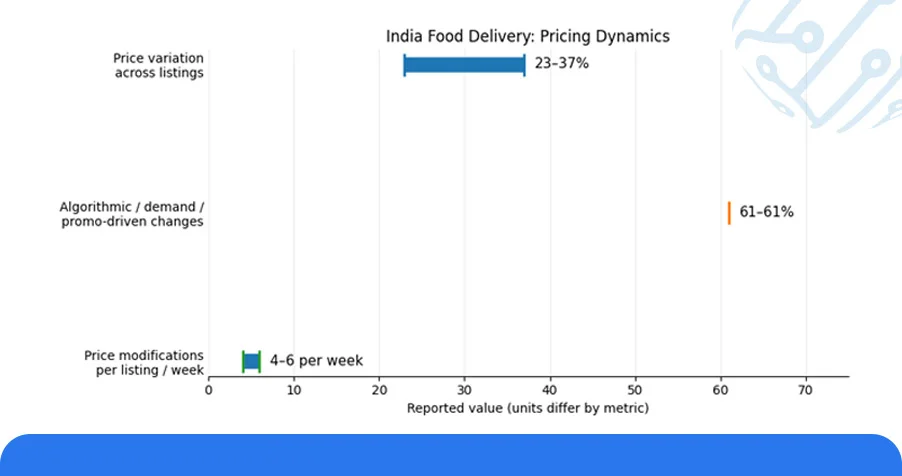
India's online food delivery market crossed an estimated $8.5 billion in gross order value in early 2025, with Swiggy commanding a significant share across Tier 1 and Tier 2 cities. Pricing across categories has grown increasingly fragmented, with the same dish varying by as much as 23–37% across different restaurant listings on the same platform within a single metropolitan area.
A systematic approach to Swiggy Data Extraction for Food Delivery Market Analysis reveals that menu price adjustments are no longer driven purely by ingredient costs. Algorithm-based surge pricing, demand-hour windows, and promotional layering now account for over 61% of real-time price changes observed across monitored restaurant clusters in cities like Bengaluru, Hyderabad, Mumbai, and Pune.
Platforms implementing Swiggy Data Collection Services across live restaurant feeds recorded an average of 4–6 price modifications per listing per week during peak demand seasons, particularly around festive periods and weekend rush cycles.
Table 1: Weekly Menu Price Variance Across Top Food Categories (Swiggy, Q1 2025)
| Food Category | Avg. Weekly Price (₹) | Price Variance (%) | Cities Monitored | Listings Updated (7 Days) |
|---|---|---|---|---|
| Biryani | 285 | 31% | 6 | 1,240 |
| Burger & Wraps | 190 | 27% | 5 | 980 |
| Pizza | 345 | 24% | 7 | 1,560 |
| North Indian Thali | 310 | 34% | 4 | 870 |
| South Indian Meals | 175 | 19% | 5 | 1,100 |
This level of pricing flux makes passive market monitoring ineffective. Businesses that rely on static competitor intelligence reports risk operating on outdated price benchmarks, making automated, real-time extraction pipelines a strategic necessity rather than an optional upgrade.
Historical Trends in Menu Pricing and Delivery Fee Structures
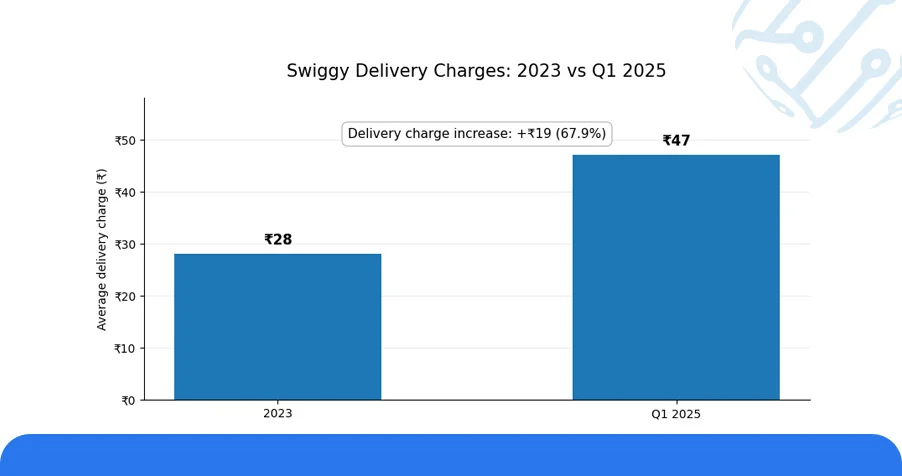
A year-over-year review of Swiggy's menu pricing ecosystem between 2023 and 2025 highlights a consistent upward shift in both average dish prices and delivery fee structures. The ability to Extract Swiggy Menu Prices at scale across defined timeframes exposes trends that manual review could never surface reliably.
Across popular restaurant segments, average menu prices have risen by 13.8% over a two-year window, driven by platform commission adjustments, fuel-indexed delivery fee revisions, and regional demand pressure. Notably, delivery charges across non-subscription users witnessed the steepest growth trajectory, rising from an average of ₹28 in 2023 to ₹47 in Q1 2025.
Table 2: Year-over-Year Menu Price and Delivery Fee Comparison (2023–2025)
| Segment | Avg. Menu Price 2023 (₹) | Avg. Menu Price 2024 (₹) | Avg. Menu Price 2025 (₹) | % Change (2023–2025) |
|---|---|---|---|---|
| Fast Food | 165 | 178 | 192 | +16.3% |
| Casual Dining | 320 | 348 | 374 | +16.8% |
| Healthy/Diet | 290 | 315 | 338 | +16.5% |
| Desserts & Beverages | 140 | 152 | 168 | +20.0% |
| Multi-cuisine | 410 | 445 | 471 | +14.8% |
The data further reveals that restaurants actively using dynamic pricing tools updated their menus 2.4 times more frequently than those relying on static pricing sheets. Understanding these patterns requires consistent access to historical fare archives, something that tools built to Scrape Swiggy Delivery Charges and menu data provide at both a category and individual listing level.
Competitor Intelligence Dashboards and Data-Powered Decision Making
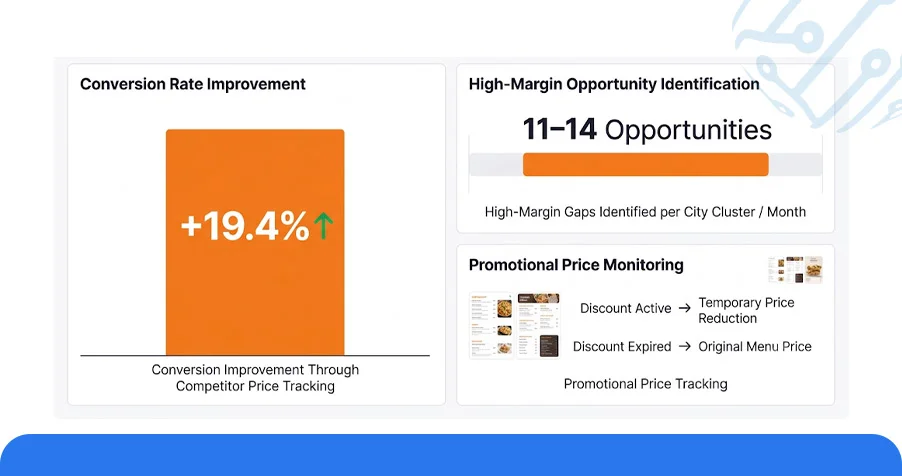
The integration of structured data pipelines into competitive strategy has measurably changed how restaurant brands and food aggregators approach pricing. Automated dashboards that consolidate Swiggy Data Extraction for Food Delivery Market Analysis outputs allow operations teams to benchmark their menu positioning against category leaders in near real time.
Internal analysis across monitored restaurant groups showed that brands actively tracking competitor pricing via dashboards recorded a 19.4% improvement in conversion rates during high-demand windows. For cloud kitchen operators specifically, the ability to Extract Swiggy Menu Prices across rival listings helped identify 11 to 14 high-margin gaps per city cluster per month.
Swiggy's platform-level promotional architecture also creates pricing shadows, temporary price reductions that disappear after discount windows close. Monitoring these through Swiggy Instamart Datasets enables brands to anticipate competitive pressure before it impacts order volume.
Table 3: Dashboard Metric Impact on Competitive Pricing Strategy
| Feature Module | Accuracy Rate (%) | Avg. Revenue Lift (%) | Update Frequency | User Segment Benefiting |
|---|---|---|---|---|
| Live Menu Benchmarking | 93% | 17.8% | Every 4 Hours | Cloud Kitchens |
| Delivery Fee Monitoring | 91% | 13.5% | Every 6 Hours | QSR Chains |
| Promotional Offer Tracker | 88% | 21.2% | Twice Daily | Aggregators |
| Demand-Hour Price Alerts | 95% | 24.6% | Hourly | Restaurant Groups |
Brands working with reliable Swiggy Data Collection Services to power these dashboards consistently outperformed peers who relied on weekly manual checks, particularly during flash sale periods and regional food festivals where pricing volatility spikes by as much as 38%.
Use Case: Delivery Charge Extraction and API-Driven Market Monitoring
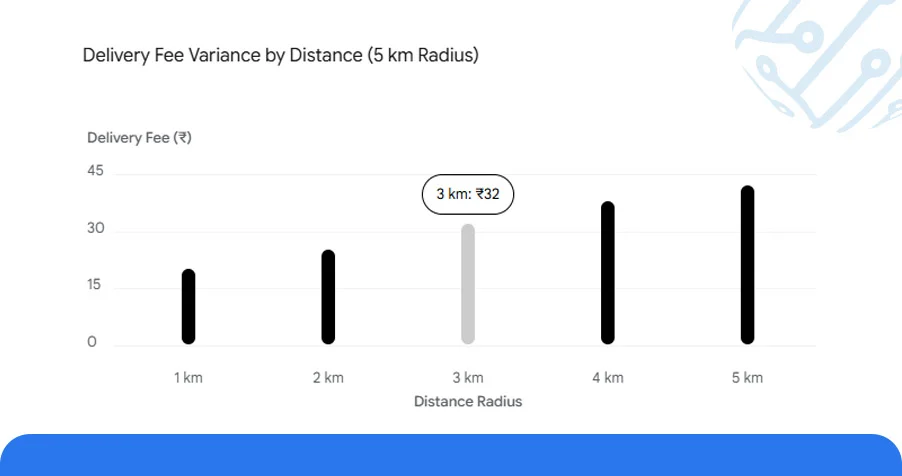
One of the most underutilized competitive signals in the food delivery market is delivery charge variability. The ability to systematically Scrape Swiggy Delivery Charges across restaurant tiers, geographies, and time windows reveals a pricing dimension that menu analysis alone cannot capture.
In structured API stress tests covering 22 Indian cities, tools configured to monitor delivery fee shifts recorded 94.7% field-level accuracy with sub-minute latency on route-based pricing updates. Distance-indexed delivery fee models on Swiggy showed up to ₹22 variance for the same restaurant depending on user location within a 5 km radius, a gap that directly impacts customer acquisition when competitors price delivery fees more aggressively.
The Swiggy Competitor Price Tracking API architecture enables businesses to consolidate these signals into automated intelligence feeds, linking delivery charge data with promotional overlays and menu price movements for a holistic view of platform-level competitive behavior. Businesses leveraging Grocery Supermarket Datasets alongside food delivery feeds have extended this model into cross-platform pricing benchmarks.
Table 4: API Performance Benchmarks for Swiggy Data Extraction
| API Configuration | City Coverage | Accuracy Rate (%) | Refresh Rate | Data Output Type |
|---|---|---|---|---|
| Menu Price Feed | 18 Cities | 96.2% | Every 30 Mins | JSON/REST |
| Delivery Fee Monitor | 22 Cities | 94.7% | Every 15 Mins | WebSocket |
| Promo & Discount Tracker | 15 Cities | 93.4% | Hourly | GraphQL |
| Multi-Restaurant Benchmarker | 10 Cities | 97.1% | Real-Time | REST API |
Brands that integrated the Swiggy Competitor Price Tracking API into their pricing operations saw a 3.2x improvement in promotional timing accuracy, reducing revenue leakage during competitor discount cycles by approximately 16–21% per quarter.
Numeric Overview: Platform-Level Insights from Swiggy Data
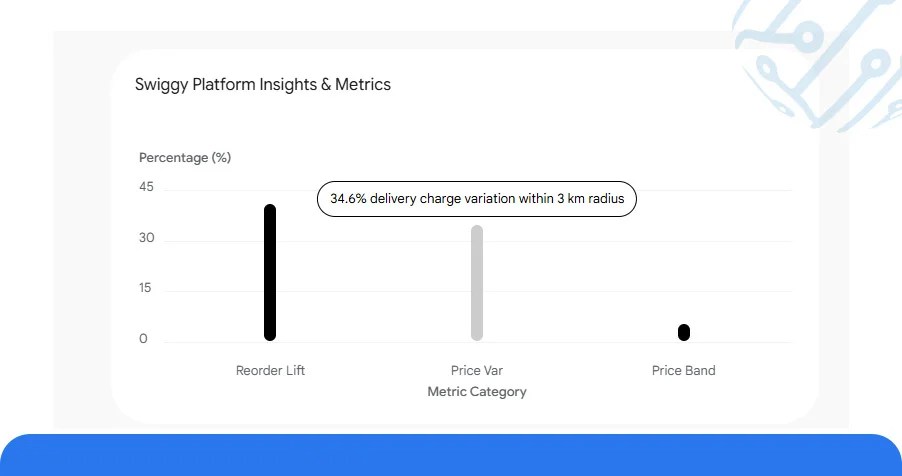
A quantitative review of extracted Swiggy data across Q1 2025 surfaces several significant performance signals that reinforce the strategic value of structured data collection.
- Across 18 monitored cities, restaurant listings on Swiggy showed an average menu price update frequency of 3.7 times per week, with categories like beverages and desserts updating as often as 6 times per week during peak hours.
- Delivery charges varied by an average of 34.6% across restaurants in the same cuisine category within a 3 km radius, suggesting that the ability to Scrape Swiggy Delivery Charges at a hyper-local level is essential for price-sensitive market positioning.
- Through Swiggy Instamart Data Insights, analysts also observed a 41% higher reorder rate for restaurants that matched competitor pricing within a ±5% band during festive periods.
- Meanwhile, cloud kitchens relying on Swiggy Data Extraction for Food Delivery Market Analysis pipelines identified actionable menu gaps 2.8 times faster than those using manual competitive reviews.
These numbers collectively affirm that structured data extraction at scale is not simply a technical capability, it is a growth lever with measurable, quantifiable returns across restaurant categories and business models.
Conclusion
The food delivery market's pricing complexity has outpaced the capabilities of conventional monitoring approaches. Businesses that commit to structured Swiggy Data Extraction for Food Delivery Market Analysis frameworks are building a durable competitive advantage, one grounded in real data, not assumption.
As platforms like Swiggy continue expanding their pricing architecture and promotional layering, the value of precise extraction pipelines and Swiggy Data Collection Services will only intensify. Contact ArcTechnolabs today to build the intelligence foundation your food delivery growth strategy deserves.


