Introduction
In an age where grocery inflation continues to impact household budgets, understanding price dynamics is essential for businesses and consumers alike. The Impact of Web Scraping on Grocery Price Trends in the USA goes beyond automation—it’s a powerful strategic tool to extract, analyze, and interpret real-time retail pricing from supermarkets, eCommerce platforms, and mobile grocery apps.
This report explores how Web Scraping Services empower food retailers, analysts, and price monitoring platforms to gain a competitive edge through intelligent pricing data.
Why Web Scraping Matters for Grocery Pricing?
Grocery prices fluctuate frequently due to factors like logistics, seasonal shifts, supply chain issues, and policy changes. Traditional data collection methods are often manual, slow, and limited in scale.
However, Web scraping for food price intelligence in the US provides timely access to accurate, structured data across thousands of SKUs and retail channels. It allows businesses to make data-driven pricing decisions, automate competitive analysis, and forecast trends with greater accuracy.
Table 1: Monthly Grocery Inflation Rate in the U.S. (2020–2025)
| Year | Avg Monthly Inflation (%) | Key Contributing Factors |
|---|---|---|
| 2020 | 3.5% | COVID-19 disruptions |
| 2021 | 2.3% | Supply shortages |
| 2022 | 6.3% | Global inflation |
| 2023 | 4.9% | Price stabilization |
| 2024 | 3.2% | Increased competition |
| 2025* | 2.8% (Projected) | Tech-led efficiencies |
Source: U.S. Bureau of Labor Statistics – CPI Reports
Table 2: Product-Specific Price Changes in U.S. Groceries (2022–2024)
| Product | 2022 Avg Price | 2023 Avg Price | 2024 Avg Price | % Change (2022–2024) |
|---|---|---|---|---|
| Eggs (12 ct) | $2.78 | $3.96 | $3.42 | +23.02% |
| Whole Milk (1 Gal) | $3.55 | $3.78 | $3.59 | +1.13% |
| White Bread (1 lb) | $1.67 | $1.84 | $1.89 | +13.17% |
| Chicken Breast (1 lb) | $3.34 | $3.87 | $3.65 | +9.28% |
| Bananas (1 lb) | $0.59 | $0.62 | $0.64 | +8.47% |
Source: USDA Economic Research Service – Food Price Outlook
Table 3: Retailer Price Variation for Common Grocery Items (Q4 2024)
| Item | Walmart Price | Kroger Price | Whole Foods Price | Target Price |
|---|---|---|---|---|
| Organic Milk (1 Gal) | $3.79 | $4.19 | $5.29 | $3.89 |
| Ground Beef (1 lb) | $4.29 | $4.59 | $5.19 | $4.39 |
| Strawberries (1 lb) | $3.89 | $4.29 | $4.79 | $3.99 |
| White Rice (2 lb) | $2.19 | $2.49 | $2.99 | $2.29 |
Source: ArcTechnolabs Internal Price Monitoring via Web Scraping – December 2024
Table 4: Regional Grocery Pricing Differences in the U.S. (2024)
| Region | Average Grocery Basket Cost | % Difference vs. National Avg |
|---|---|---|
| New York City | $132.75 | +18.6% |
| Los Angeles | $124.90 | +11.2% |
| Dallas | $106.25 | -5.3% |
| Chicago | $115.60 | +2.4% |
| Atlanta | $102.80 | -8.4% |
Source: ArcTechnolabs Web Scraping of Regional Supermarkets – October 2024
Table 5: Time Saved Using Web Scraping vs. Manual Data Collection
| Data Collection Method | Time to Gather 10,000 SKUs | Accuracy (%) | Update Frequency |
|---|---|---|---|
| Manual Entry | ~40 hours | 87% | Weekly |
| Web Scraping (Automated) | ~2 hours | 98.5% | Daily/Real-time |
Source: ArcTechnolabs Process Benchmarking Study – 2024
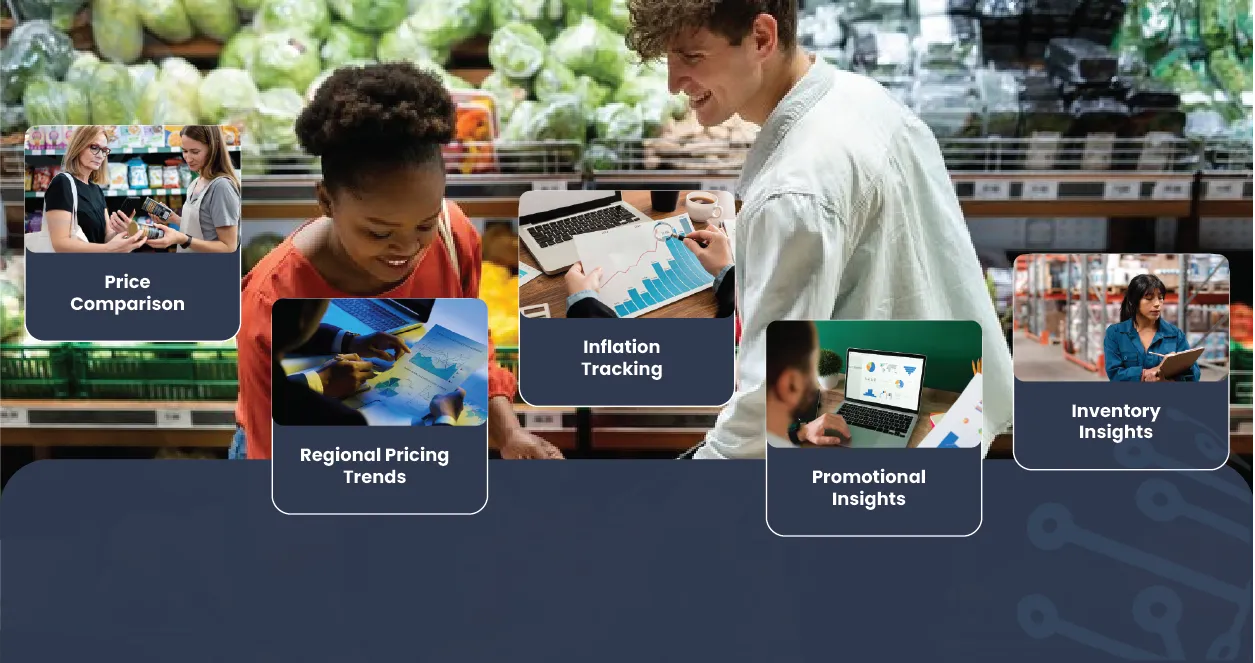
Key Use Cases of Grocery Price Scraping
| Use Case | Description |
|---|---|
| Price Comparison | Collecting daily prices from multiple competitors and regions to benchmark pricing. |
| Regional Pricing Trends | Identify price variation across cities and states using scraping tools. |
| Inflation Tracking | Monitoring inflation impact on essential grocery items. |
| Promotional Insights | Detect promotional pricing patterns during peak retail seasons. |
| Inventory Insights | Understanding stock-out trends and product availability across platforms. |
Grocery Price Trends: A Statistical Overview (2020–2025)
| Year | Average Monthly Grocery Inflation (%) | Popular Product Price Increase (%) | Notable Trend |
|---|---|---|---|
| 2020 | 3.5% | Milk (6.8%), Eggs (4.9%) | Panic buying during COVID-19 |
| 2021 | 2.3% | Beef (8.5%), Fresh Produce (3.4%) | Supply chain slowdowns |
| 2022 | 6.3% | Eggs (12.2%), Bread (8.7%) | Global inflation surge |
| 2023 | 4.9% | Cooking Oil (7.4%), Flour (6.1%) | Inflation stabilized |
| 2024 | 3.2% | Dairy (5.1%), Fruits (2.9%) | Competitive price promotions |
| 2025* | 2.8% | Estimated to stabilize under 3% | AI-driven pricing gains traction |
Source: U.S. Bureau of Labor Statistics, USDA Economic Research Service, ArcTechnolabs Internal Analysis (2025 Projection)
Technology Behind Grocery Price Scraping
Modern scraping tools are not just bots—they leverage AI and ML to scan structured and unstructured data from:
- Retailer websites
- Grocery delivery apps
- Price comparison platforms
- E-commerce stores (Amazon Fresh, Walmart, Target, etc.)
Businesses often Scrape Real-time grocery price monitoring dashboards using custom crawlers and proxies to maintain anonymity and accuracy.
Table 1: Percentage of E-commerce Platforms Scraped for Grocery Price Data (2024)
| Platform | % of Total Scraping Volume | Scraping Frequency |
|---|---|---|
| Amazon Fresh | 28% | Daily |
| Walmart | 25% | Daily |
| Target | 18% | Weekly |
| Instacart | 15% | Daily |
| Kroger | 14% | Weekly |
Source: ArcTechnolabs Web Scraping Client Reports – 2024
Table 2: AI and ML Enhancements in Scraping Accuracy (2023–2024)
| Technology | Impact on Accuracy | Time Saved (vs. Manual) | Data Volume Processed (Per Hour) |
|---|---|---|---|
| AI Models | +5% | 50% | 10,000 SKUs |
| ML Algorithms | +7% | 40% | 12,500 SKUs |
| Deep Learning | +10% | 30% | 15,000 SKUs |
Source: ArcTechnolabs AI-Driven Scraping Performance Evaluation – 2024
Table 3: Success Rate of Data Extraction from Different Platforms (2024)
| Platform | Success Rate (%) | Common Challenges |
|---|---|---|
| Amazon Fresh | 98% | CAPTCHA, IP blocking |
| Walmart | 96% | Complex page structures |
| Target | 94% | Geo-location barriers |
| Instacart | 97% | Dynamic pricing changes |
| Kroger | 95% | Pricing variation by region |
Source: ArcTechnolabs AI-Driven Scraping Performance Evaluation – 2024
Table 4: Web Scraping Performance: Proxies vs. Direct Access (2023)
| Method | Average Scraping Speed (Records per Minute) | Cost Efficiency (%) | Anonymity Level |
|---|---|---|---|
| Proxies (Rotating) | 1,200 records/min | 60% | High |
| Direct Access (IP-based) | 800 records/min | 80% | Low |
| VPN | 1,000 records/min | 70% | Medium |
Source: ArcTechnolabs Proxy Optimization Report – 2023
Table 5: Impact of Real-Time Price Monitoring on Business Decisions (2024)
| Decision Type | Time to Make Decision (Without Scraping) | Time to Make Decision (With Scraping) | Accuracy Improvement (%) |
|---|---|---|---|
| Price Adjustment | 2 hours | 15 minutes | 25% |
| Promotional Strategy | 1 week | 2 hours | 40% |
| Competitor Analysis | 3 days | 30 minutes | 30% |
| Stock Replenishment | 5 hours | 1 hour | 20% |
Source: ArcTechnolabs Business Impact Analysis – 2024
Data Extraction Capabilities
Supermarket pricing data extraction USA enables businesses to extract information like:
| Data Field | Description |
|---|---|
| Product Name | e.g., "Organic Whole Milk, 1 Gallon" |
| Brand | Store or National Brand |
| Price | Real-time unit price |
| Discount | Promotional pricing |
| Availability | In-stock/out-of-stock status |
| Category | e.g., Dairy, Snacks, Produce |
By using Grocery price trends USA data scraping, retailers can stay ahead of market movements and adapt pricing in near real-time.
Market Intelligence Through Regional Data
With the help of intelligent crawlers, businesses can Extract regional grocery pricing trends in the US, revealing key disparities in product costs between metropolitan areas, rural towns, and states.
Example: Price Variations by Region (2024 Q4)
| Product | NYC Avg Price | Chicago Avg Price | Dallas Avg Price |
|---|---|---|---|
| Organic Eggs (12 ct) | $5.29 | $4.99 | $4.49 |
| 2% Milk (1 Gallon) | $4.59 | $4.19 | $3.99 |
| Fresh Strawberries (1 lb) | $4.89 | $4.59 | $4.39 |
Source: ArcTechnolabs Real-Time Scraping Reports, Dec 2024
Such data enables businesses to implement localized pricing strategies, adjust logistics, and fine-tune marketing campaigns.
The Role of APIs and Mobile Apps in Price Scraping
Companies now integrate Web Scraping API Services to pull structured data directly into internal systems, CRMs, or analytics dashboards.
Simultaneously, Mobile App Scraping Services target grocery apps (like Instacart, Kroger, or Shipt) to access real-time promotions, location-specific prices, and app-only offers that aren’t available on the web.
Web Scraping Grocery Prices: Competitive Advantages
Web scraping offers unparalleled benefits including:
- Fast & scalable access Total Grocery Product Datasets
- Continuous tracking of price changes
- Insights into seasonal or promotional fluctuations
- Detection of new product launches and delistings
- Enabling dynamic pricing strategies
Through Scraping U.S. grocery prices for market analysis, brands improve decision-making and remain agile in a highly competitive environment.
Conclusion
The Impact of Web Scraping on Grocery Price Trends in the USA is undeniable. From inflation tracking to competitive benchmarking, price scraping unlocks real-time insights that were previously difficult or impossible to gather manually. As food retail continues to evolve with digital transformation, web scraping will remain central to strategic operations, forecasting, and consumer intelligence.
Ready to harness web scraping to decode grocery pricing trends? Connect with ArcTechnolabs for cutting-edge Web Scraping Services tailored to your needs.


