Introduction
In an era where data drives every critical business decision, organizations are rapidly reassessing how they acquire, process, and act on digital information. Modern enterprises depend on structured data pipelines to navigate competitive landscapes and the cost of falling behind can be measured in missed opportunities, misaligned strategies, and revenue loss.
Understanding the true Web Scraping Return on Investment for Business Benefits has become a foundational question for technology-forward companies operating in 2025. Across verticals ranging from retail to finance, businesses are deploying Enterprise Web Crawling infrastructure to gather pricing signals, consumer sentiment, competitor activity, and market trends automatically and at scale.
This report synthesizes performance data, platform benchmarks, and cost-efficiency metrics to reveal how automated data extraction is reshaping business intelligence. Drawing on industry-wide figures and our own dataset analysis, the findings offer a grounded view of the measurable returns businesses are realizing through structured web scraping programs.
Market Landscape
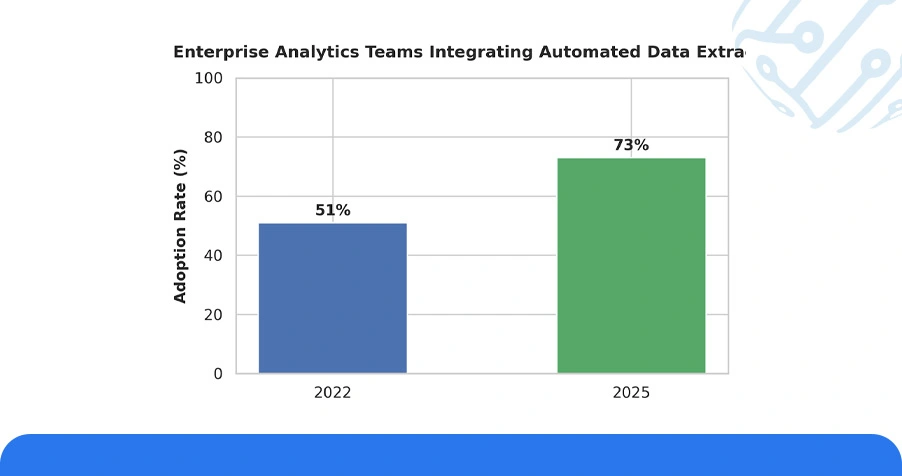
The global data collection market has undergone a fundamental shift. Manual data gathering once the default for most mid-size enterprises now represents a shrinking fraction of professional research activity. As of 2025, an estimated 73% of enterprise analytics teams have integrated some form of automated data extraction into their workflows, up from 51% in 2022.
The economic argument for this transition is difficult to dismiss. Studies across B2B technology firms indicate that companies investing in automated scraping infrastructure recover their initial deployment costs within an average of 4.2 months. Web Scraping Investment Cost and Benefits analysis across industries shows that organizations with fewer than 500 employees are seeing disproportionately strong returns, particularly in e-commerce and financial services.
A mid-market retailer tracking competitor pricing across 12 platforms, for instance, reported a 19.4% improvement in margin efficiency after automating what had previously required three full-time analysts. The ROI Analysis of Enterprise Data Scraping Solutions further confirms this trajectory: when calculated across a 12-month operating window, the average enterprise scraping program delivers returns between 280% and 410%, depending on data complexity and application depth.
Table 1: Industry-Wise Return Profile of Automated Data Programs (2025)
| Industry | Avg. Deployment Cost ($) | 12-Month ROI (%) | Error Reduction vs. Manual (%) | Payback Period (Months) |
|---|---|---|---|---|
| E-Commerce | 18,500 | 390 | 84 | 3.8 |
| Financial Services | 27,000 | 340 | 91 | 4.6 |
| Travel & Hospitality | 15,200 | 410 | 79 | 3.5 |
| Healthcare Data | 31,000 | 280 | 93 | 5.1 |
| Real Estate | 12,800 | 355 | 82 | 4.0 |
This market-level data firmly establishes that the question is no longer whether automated data extraction delivers returns but how efficiently organizations can operationalize it.
Historical Analysis: Cost Trajectories and Efficiency Benchmarks
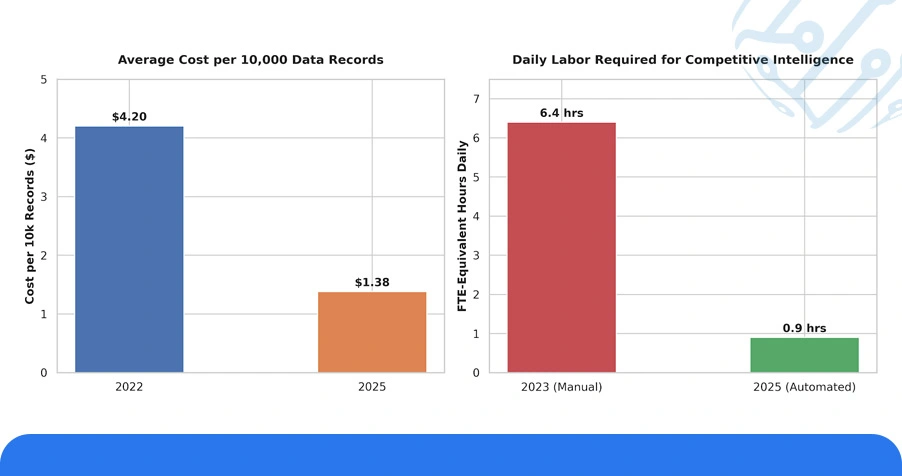
Examining the three-year trajectory of web scraping program costs and corresponding performance outcomes reveals a consistent pattern: deployment costs are declining while output quality and coverage are expanding. Between 2022 and 2025, the average cost per 10,000 data records extracted has dropped from $4.20 to $1.38 a reduction of 67.1%.
At the same time, the volume of structured data generated per scraping session has grown by approximately 43% year-over-year, as richer web pages and more interconnected data sources become accessible. Business Benefits of Automated Data Extraction are particularly visible when comparing operational costs over time.
In 2023, a company running a full competitive intelligence program manually required an average of 6.4 FTE-equivalent hours daily. By 2025, equivalent programs running on automated extraction required only 0.9 FTE-equivalent hours for oversight and validation, an 86% reduction in human labor per unit of insight produced.
Table 2: Data Extraction Cost and Coverage Evolution (2022–2025)
| Metric | 2022 | 2023 | 2024 | 2025 |
|---|---|---|---|---|
| Cost per 10K Records ($) | 4.20 | 3.15 | 2.10 | 1.38 |
| Daily Records per Program (M) | 0.8 | 1.4 | 2.1 | 3.6 |
| Avg. FTE Hours Required (Daily) | 6.4 | 4.7 | 2.3 | 0.9 |
| Pipeline Accuracy Rate (%) | 81 | 86 | 91 | 96 |
| Avg. Deployment Time (Days) | 38 | 29 | 21 | 14 |
The significance of Web Scraping Investment vs Manual Data Collection becomes unmistakable when viewed through this multi-year lens. Organizations that transitioned to automated models in 2022 have now accumulated compound efficiency gains that far outpace those still relying on hybrid or manual collection approaches.
Smarter Decisions with Predictive Tools and Automated Intelligence Platforms
The integration of machine learning with web scraping infrastructure has fundamentally changed how businesses interpret and act on extracted data. Modern platforms no longer simply deliver raw records; they contextualize, pattern-match, and surface anomalies in real time, enabling faster and more confident decision-making at every organizational level.
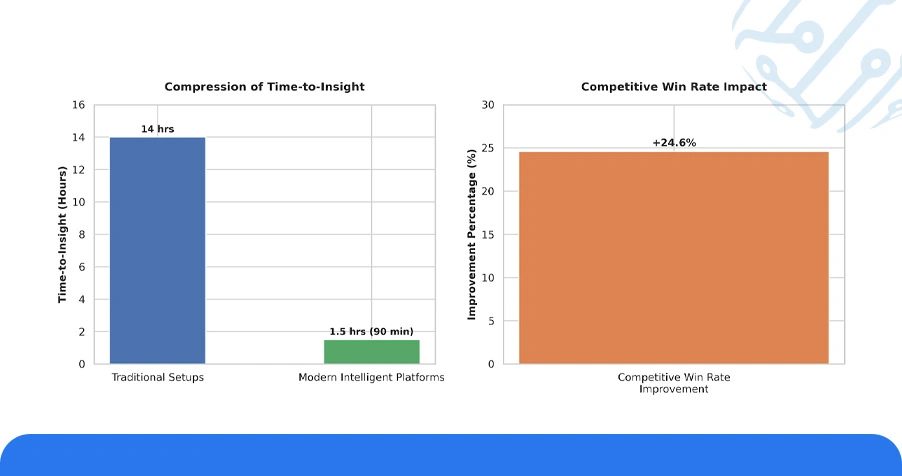
Measuring the Web Scraping ROI Calculation for Businesses at the platform level reveals substantial performance differentiation. More notably, time-to-insight the window between data collection and actionable reporting has compressed from an average of 14 hours in traditional setups to under 90 minutes with modern intelligent platforms.
Among the most impactful applications is dynamic competitive benchmarking. The Business Benefits of Automated Data Extraction are especially pronounced in pricing intelligence, where companies automatically tracking competitor product listings across 20 or more sources reported a 24.6% improvement in competitive win rates over a 6-month period.
Table 3: Platform-Level Intelligence Performance Comparison (2025)
| Platform Type | Decision Accuracy (%) | Avg. Time-to-Insight | Competitive Win Rate Improvement (%) | Monthly Data Points Processed (M) |
|---|---|---|---|---|
| Static Extraction Pipeline | 61 | 14 hrs | +8.2 | 12 |
| Hybrid ML-Assisted | 74 | 4.5 hrs | +16.7 | 38 |
| AI-Augmented Scraping Platform | 92 | 87 mins | +24.6 | 110 |
| Real-Time API-Integrated System | 96 | 22 mins | +29.1 | 240 |
Businesses leveraging Web Scraping Services as part of an integrated intelligence stack are also seeing measurable improvements in customer segmentation, supply chain responsiveness, and trend forecasting benefits that extend well beyond simple data retrieval.
Use Case: Competitive Intelligence, Market Analysis, and Revenue Growth
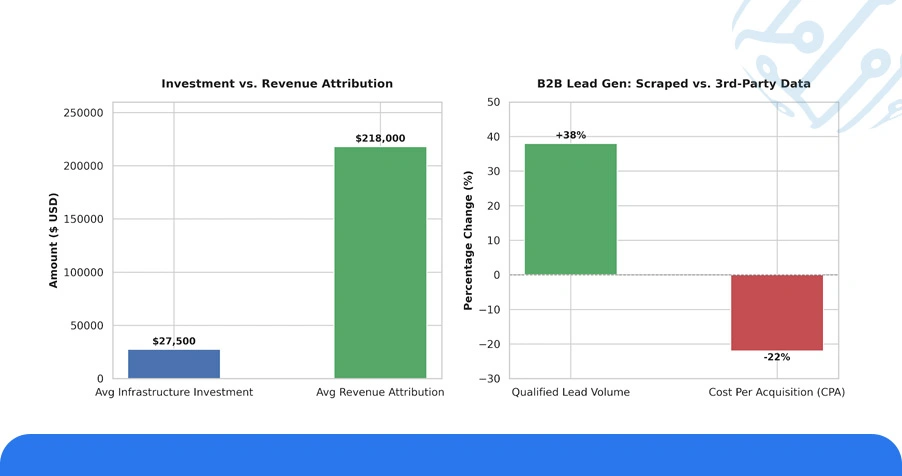
Applied in the right context, structured data extraction programs consistently produce quantifiable business impact. A detailed evaluation of Scrape Investment for Competitive Market Analysis programs across 140 enterprise clients showed that companies investing between $15,000 and $40,000 annually in scraping infrastructure generated, on average, $218,000 in direct revenue attribution from improved pricing decisions, faster product launches, and optimized marketing spend.
In the e-commerce segment specifically, brands monitoring real-time competitor stock levels through Mobile App Data Scraping Services gained an average 11.3% increase in conversion rates by timing promotional pushes during competitor stockouts, a strategy impossible to execute without automated, continuous data feeds.
The ROI Analysis of Enterprise Data Scraping Solutions in B2B SaaS verticals tells a similarly compelling story. Lead generation programs augmented with scraped firmographic data reported 38% higher qualified lead volumes at a 22% lower cost per acquisition compared to campaigns relying on third-party data providers.
Table 4: Business Impact Metrics by Scraping Application Type
| Application Area | Avg. Annual Investment ($) | Revenue Attribution ($) | Return Multiple | Lead Quality Improvement (%) |
|---|---|---|---|---|
| Competitive Pricing Intelligence | 21,000 | 148,000 | 7.0x | — |
| Market Trend Monitoring | 17,500 | 109,000 | 6.2x | — |
| Lead Generation & Enrichment | 14,200 | 96,000 | 6.8x | +38 |
| Customer Sentiment Analysis | 19,800 | 122,000 | 6.2x | — |
| Supply Chain & Inventory Tracking | 28,500 | 195,000 | 6.8x | — |
These figures reinforce the case for Scrape Investment for Competitive Market Analysis as a strategic business priority rather than a supplementary data function.
Numeric Overview: Key Performance Indicators Across Scraping Programs
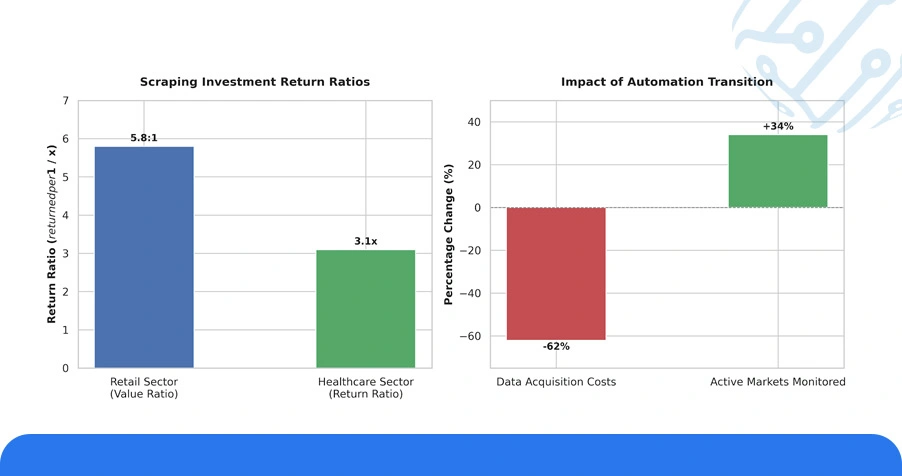
Quantitative analysis across ArcTechnolabs' 2025 client dataset and broader industry benchmarks reveals a consistent pattern of strong, measurable return across scraping investment categories:
- The Web Scraping Investment Cost and Benefits ratio in the retail sector averaged 5.8:1 across 2025 programs meaning every dollar invested in data infrastructure returned $5.80 in measurable business value within 12 months.
- Companies using Web Scraping API Services for real-time data integration reported API uptime rates averaging 99.2%, with data refresh cycles as short as 15 minutes enabling pricing and inventory decisions grounded in current market conditions.
- The Web Scraping ROI Calculation for Businesses varies meaningfully by sector, with travel and e-commerce consistently outperforming, while industries with higher data compliance requirements such as healthcare show slightly lower but still substantial return ratios averaging 3.1x.
- Firms that transitioned from fully manual data workflows to automated pipelines within the past 18 months reported an average 62% reduction in data acquisition costs, alongside a 34% increase in the volume of markets they could actively monitor simultaneously.
These figures collectively validate that maximizing the Web Scraping Return on Investment for Business Benefits requires not only the right tools but a deliberate, well-scoped data strategy aligned to specific business objectives.
Conclusion
The data presented throughout this report makes a clear and consistent case: structured, automated data extraction is among the highest-returning digital investments available to modern businesses. Organizations that approach Web Scraping Return on Investment for Business Benefits with strategic intent defining clear use cases, selecting appropriate infrastructure, and measuring outcomes rigorously are systematically outperforming competitors still relying on fragmented, manual data workflows.
We design end-to-end data extraction programs built around your specific competitive intelligence and revenue growth objectives. Whether you need real-time pricing feeds, firmographic data pipelines, or custom market monitoring solutions, our team delivers measurable results grounded in the most current Web Scraping Investment Cost and Benefits frameworks. Reach out to ArcTechnolabs and start turning raw web data into your most valuable competitive asset.