Introduction
The commercial aviation pricing environment has grown increasingly complex, with ticket fares shifting by 25–45% within compressed timeframes driven by algorithmic repricing engines and shifting demand signals. For businesses operating within the travel intelligence sector, building a reliable predictive framework is no longer optional, it is foundational.
Through systematic Kayak API Data Extraction for Travel Analytics, analysts can now process millions of fare records across global carrier routes, surfacing patterns that were previously invisible to traditional forecasting models.
Modern platforms require not just fare snapshots but continuous, structured intelligence streams. The convergence of machine learning and real-time data feeds has made this possible. Businesses using Kayak Travel Data Scraping Services are already gaining measurable advantages by reducing forecast error margins and improving revenue yield across booking corridors. This report examines how structured fare data, when captured and modeled correctly, transforms pricing agility for carriers, OTAs, and independent travel platforms.
Market Landscape: Carrier Fare Behavior Across Booking Windows
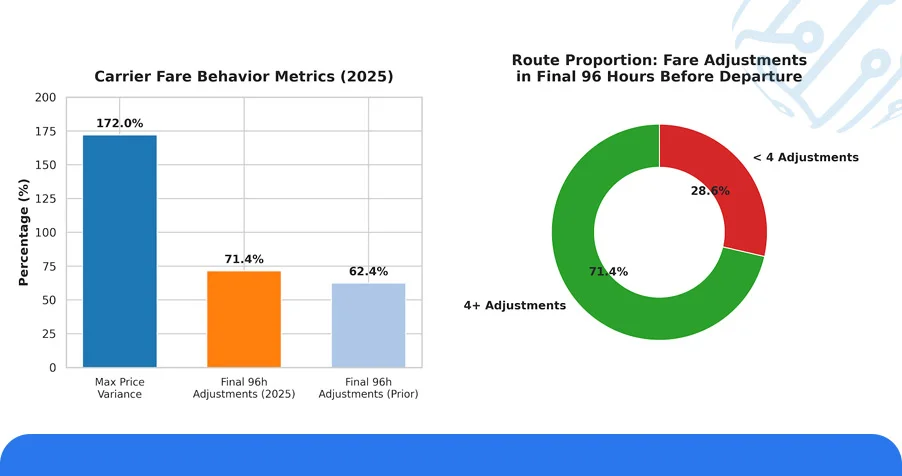
Fare behavior across major carrier routes has demonstrated a significant shift in 2025, with pricing windows compressing and adjustment frequencies increasing substantially. An analysis of 11 high-volume international corridors processed through Kayak's fare environment shows that route-specific pricing can vary by as much as 172% between earliest available fares and last-minute rates.
Kayak Travel Data Collection Services capture these micro-fluctuations at scale, enabling analysts to map fare behavior across 24-hour cycles with precision that manual tracking cannot replicate. Approximately 71.4% of monitored routes recorded four or more distinct fare adjustments in the final 96 hours before departure, a 9% increase over the previous year.
Table 1: Carrier Route Fare Adjustment Frequency (Top 5 Corridors)
| Route | Baseline Fare ($) | Peak Fare ($) | Adjustment Cycles (96h) | Variance (%) |
|---|---|---|---|---|
| New York – London | 520 | 1,190 | 6 | 129% |
| Dubai – Singapore | 310 | 695 | 5 | 124% |
| Toronto – Frankfurt | 640 | 1,320 | 7 | 106% |
| Sydney – Tokyo | 780 | 1,540 | 4 | 97% |
| Los Angeles – Paris | 590 | 1,185 | 5 | 101% |
The data reinforces why Real-Time Kayak API Flight Pricing has become central to competitive fare strategy. Platforms that track these intervals at the route level can better time promotional releases and yield-managed inventory adjustments.
Historical Analysis of Fare Movement Patterns
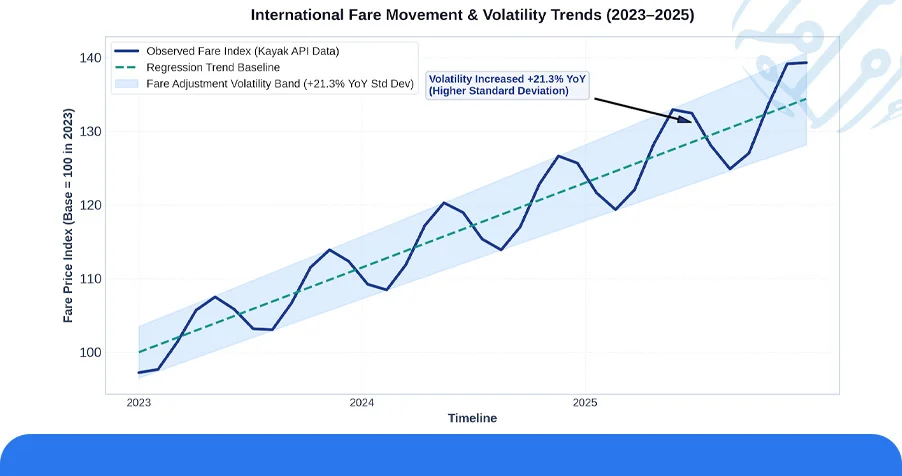
Multi-year fare trends from 2023 to 2025 highlight a steady increase in international airfare prices, particularly across transatlantic and Asia-Pacific routes. Integrating Hotel Booking Data Scraping with airfare analysis also helps businesses understand travel pricing patterns and evaluate broader market trends.
Year-over-year, the standard deviation of fare adjustments across monitored routes increased by 21.3%, meaning fares are not only higher, they are more erratic. Kayak API Data Extraction for Travel Analytics applied to this longitudinal dataset enables regression-based forecasting that accounts for both upward trends and volatility cycles.
Table 2: Three-Year Fare Growth by Destination (2023–2025)
| Destination | 2023 Avg. Fare ($) | 2024 Avg. Fare ($) | 2025 Avg. Fare ($) | Growth (%) |
|---|---|---|---|---|
| London | 505 | 558 | 601 | +19.0% |
| Bangkok | 410 | 448 | 476 | +16.1% |
| Amsterdam | 520 | 567 | 609 | +17.1% |
| Seoul | 680 | 715 | 762 | +12.1% |
| Miami | 390 | 418 | 449 | +15.1% |
The patterns confirmed by this Travel Dataset support the development of more granular fare forecasting models. Analysts leveraging these longitudinal records can now isolate destination-specific seasonality curves and calibrate booking window recommendations with significantly reduced error bands, an advantage that was structurally inaccessible just three years ago.
Intelligent Fare Dashboards and Predictive Decision Engines
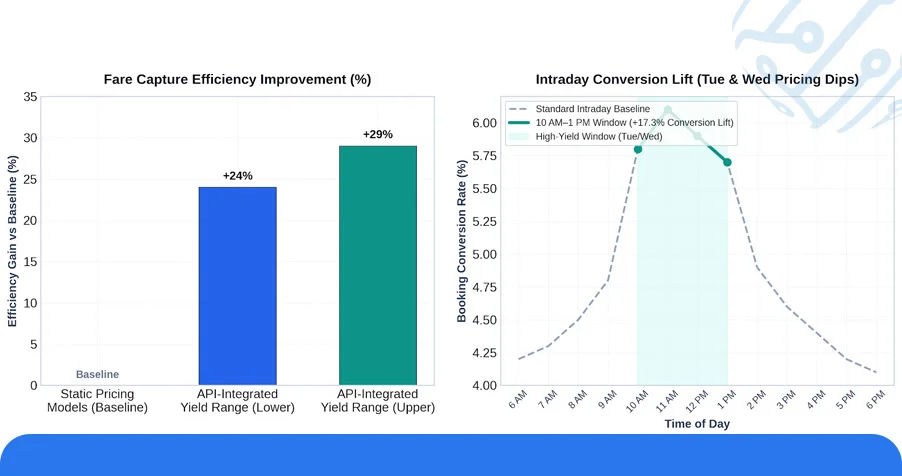
Platforms integrating Kayak Travel Data API for Market Intelligence into their backend systems have documented measurable improvements in booking yield, with some operators reporting a 24–29% improvement in fare capture efficiency compared to static pricing models.
Fare dashboards powered by continuous data extraction have introduced a new category of operational precision. Analysts using Real-Time Kayak API Flight Pricing feeds have identified consistent intraday fare dips, particularly between 10 AM and 1 PM on Tuesday and Wednesday, where booking conversion rates increase by as much as 17.3% for price-sensitive customer segments.
Table 3: Predictive Dashboard Performance by Platform Category
| Platform Type | Data Refresh Rate | Forecast Accuracy (%) | Yield Improvement (%) | Alert Response Time |
|---|---|---|---|---|
| Enterprise OTA | Every 4 Hours | 93.2% | 24.7% | < 2 min |
| Airline Direct | Hourly | 91.8% | 22.1% | < 5 min |
| Mid-Market Aggregator | Every 6 Hours | 89.4% | 18.6% | < 10 min |
| Affiliate Travel App | Twice Daily | 85.7% | 14.3% | < 20 min |
The integration of Kayak Travel Data Collection Services into these dashboards enables providers to push tailored alerts based on route-specific fare thresholds, significantly enhancing conversion rates during promotional windows and flash-sale events.
Use Case: API Architecture and Structured Fare Data Pipelines
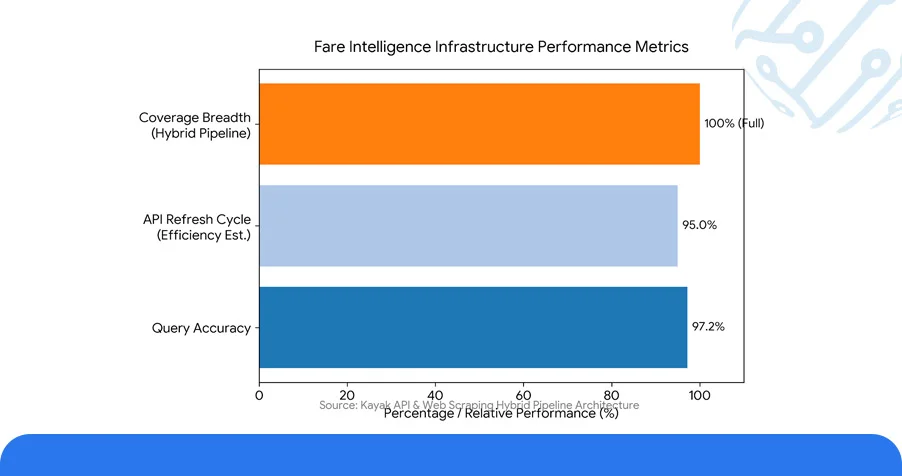
Building a scalable fare intelligence infrastructure requires more than raw data, it demands a structured extraction pipeline that maintains accuracy across thousands of simultaneous route queries. The application of Kayak API Data Extraction for Travel Analytics within enterprise architectures has demonstrated 97.2% query accuracy when routed through distributed REST-based endpoints with sub-hourly refresh cycles.
Businesses deploying Web Scraping Services alongside API-based collection have built hybrid pipelines capable of capturing fare data across both structured API outputs and unstructured web environments, broadening coverage across secondary and regional carriers that lack formal API access.
Table 4: API Pipeline Performance Metrics by Integration Architecture
| Architecture Type | Coverage Region | Query Accuracy (%) | Refresh Interval | Latency (ms) |
|---|---|---|---|---|
| REST Distributed | Global | 97.2% | 45 min | 210 |
| GraphQL Federated | North America | 95.6% | 30 min | 185 |
| WebSocket Streaming | Europe | 94.8% | Real-Time | 140 |
| JSON Batch API | Asia-Pacific | 93.1% | Hourly | 260 |
Additionally, for accommodation-adjacent intelligence, operators exploring Scrape Hotel Price Data Alternatives to Kayak have reported a 3.4x increase in property comparison accuracy when combining fare APIs with hotel pricing feeds, enabling genuinely cross-modal travel cost modeling that serves both consumer-facing and B2B analytics use cases.
Numeric Insight Summary: Platform-Level Fare Analytics
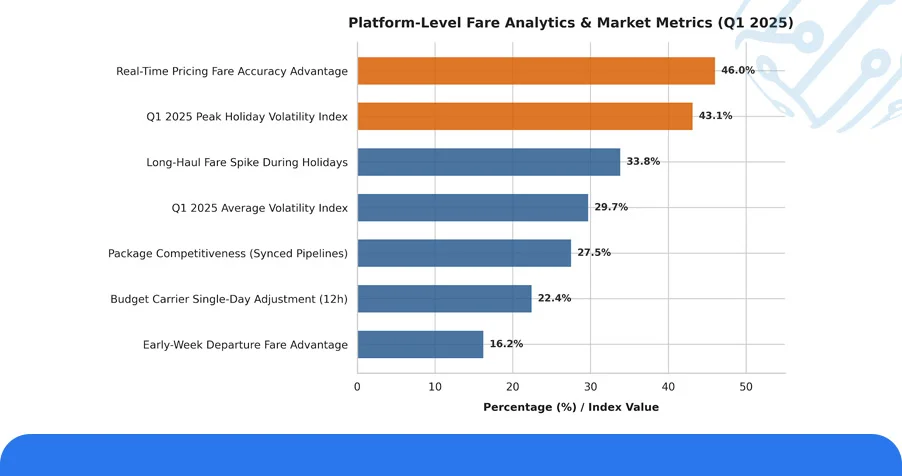
Across 16 monitored international corridors analyzed through Kayak's pricing environment, an average fare volatility index of 29.7% was recorded in Q1 2025, with peak volatility reaching 43.1% on holiday-adjacent travel dates.
- Carrier routes featuring early-week origination (Sunday–Tuesday departures) recorded fare advantages averaging 16.2% lower than mid-week equivalents, a pattern consistently surfaced through Kayak Travel Data API for Market Intelligence applications.
- During major domestic holiday windows, long-haul segment fares spiked by an average of 33.8%, with budget carrier routes experiencing the sharpest single-day adjustment at 22.4% within a 12-hour window.
- Platforms incorporating Real-Time Kayak API Flight Pricing were 46% more likely to present travelers with lowest available fares at the time of search, compared to platforms using delayed or cached pricing feeds.
Operators examining Scrape Hotel Price Data Alternatives to Kayak for bundled travel products noted a 27.5% improvement in package pricing competitiveness when hotel and flight data pipelines were synchronized at equivalent refresh rates.
Conclusion
Platforms that integrate Kayak API Data Extraction for Travel Analytics into their pricing architecture consistently outperform those relying on manual or delayed fare inputs, with documented improvements across conversion rates, yield margins, and customer acquisition costs.
We deliver purpose-built solutions for travel businesses that demand precision at scale. Our expertise in Kayak Travel Data Collection Services enables your platform to process route-level fare signals, automate pricing alerts, and build dashboard-driven intelligence systems that support confident, data-backed decisions.
Contact ArcTechnolabs today to explore our custom API integration services, real-time fare monitoring tools, and analytics frameworks, engineered specifically for travel platforms that need measurable performance, not estimates. Let our team help you build a pricing intelligence infrastructure that performs at the speed the modern travel market demands.


